We still believe there is a bullish opportunity nearby for treasury bonds, although the support areas we identified in our September post failed to hold. The break of expected support has caused us to revise our Elliott wave count slightly.
Looking at the iShares 20+ Year Treasury Bond ETF (NYSEARCA:TLT) we now think the best Elliott wave count is to treat price action since the December 2023 high as a sideways correction.
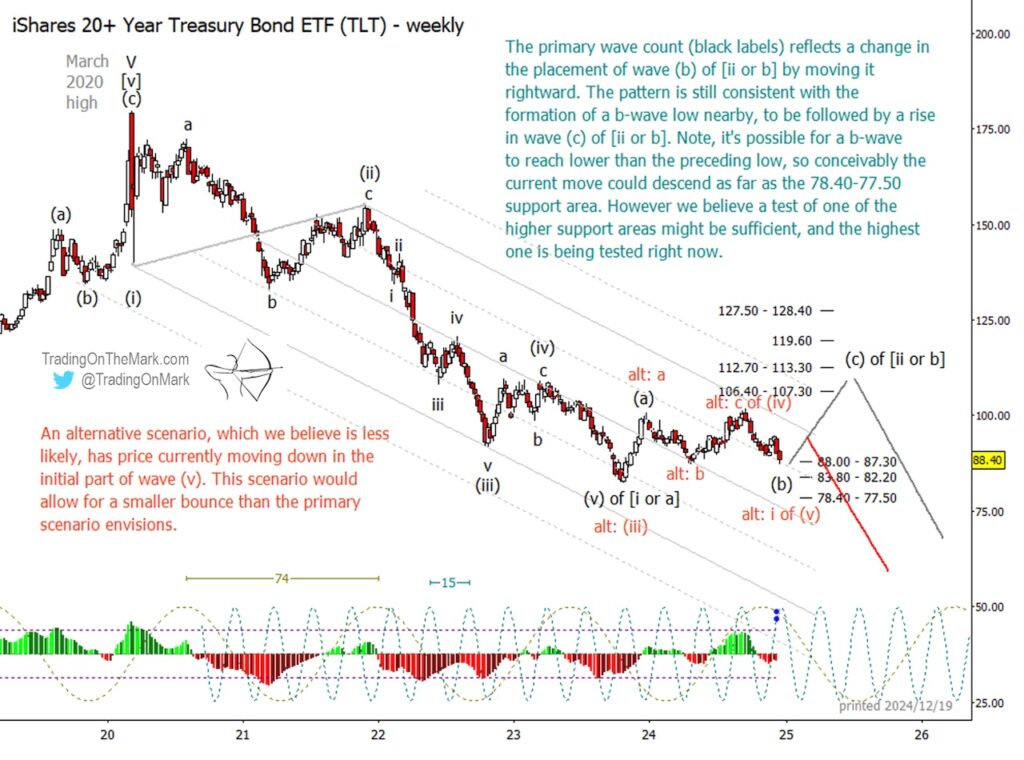
We have now designated the move off the December 2023 high as wave (b) in our primary scenario (black labels). When wave (b) is complete, it should be followed by a substantial upward impulsive wave (c) that could take the treasury bond etf (TLT) back to an area near the 2022-2023 highs.
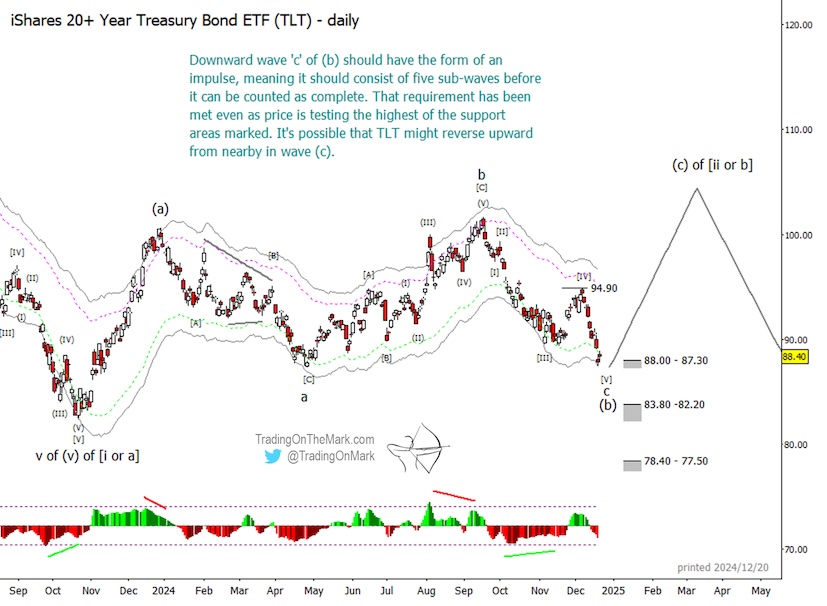
Our weekly price chart of TLT shows some zones where the last segment of wave (b) might find support for a reversal, and the nearest support area at 88.00-87.30 is a viable candidate. Traders should monitor the structure of the current downward segment on faster charts to spot signs of completion, and we show some things to watch on our daily chart.
If a bounce reversal takes place soon, then any of the price resistance areas shown on the weekly chart could become a target. We slightly favor the area near 112.70-113.30 as a place where wave (c) could end.
Note, our longer-term forecast for treasury bonds is still quite bearish, and the expected rally shown in our primary scenario would be followed by a larger decline.

On a daily price chart of TLT, it looks as though the final downward segment ‘c’ of (b) might be complete, as it now consists of five distinct sub-waves.

Our weekly chart also shows an alternative scenario for TLT with the Elliott wave count depicted in red labels. As with the primary scenario, the alternative is long-term bearish. The main difference is that the alternative treats the large impulse down from the 2020 high as not yet being complete.
In the alternative scenario, there could be a modest bounce from one of the nearby support areas to form a lower high, to be followed by a resumption of declining wave (v). We won’t really know this if the alternative is playing out until price either succeeds or fails to make a lower high in relation to the September 2024 high.
Elliott wave analysis identifies the places where the market is more likely to turn, as well as the possible target destination of a move. It also shows where price specifically should not go if the main scenario’s thesis is true. For a trader to make use of these “if this, then that” types of scenarios, it’s helpful to have guidance from people who have already integrated Elliott wave into their trading. Our newsletter follows bonds, stock indices, crude oil, currencies, metals, and related markets on weekly and daily time frames. You can also inquire about our intraday service, which is more customized.
Twitter: @TradingOnMark
The authors may have a position in the mentioned securities at the time of publication. Any opinions expressed herein are solely those of the author, and do not in any way represent the views or opinions of any other person or entity.


