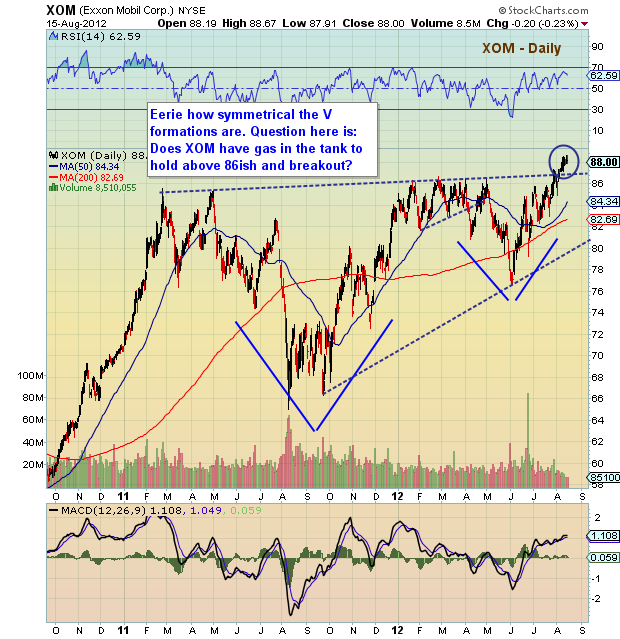
 For Exxon Mobil (XOM) stock, “V” stands for volatility and V-shaped moves. The volatility part is due in part to the previous two bouts of European contagion (and whiff of deflation), while the “V” shaped moves are the correlating pattern related to the fear-relief trade. Now above resistance, XOM is attempting to break out.
Near term, XOM needs hold above 86ish. Question is does it have the gas in the tank?
Exxon Mobil (XOM) stock chart with price support and resistance levels. XOM stock chart with technical analysis as of August 15, 2012. XOM stock attempting to break out.
———————————————————
Twitter: @andrewnyquist and @seeitmarket Facebook: See It Market
No positions in any of the securities mentioned at the time of publication.
Any opinions expressed herein are solely those of the author, and do not in any way represent the views or opinions of his employer or any other person or entity.


