The stock market remains elevated as stock bulls look to push the major indexes higher through the holidays.
Seasonality points to higher prices ahead… so does a pattern on another important index:
The IBD 50 Index
The IBD 50 index is a weekly, rules-based, computer-generated stock index compiled and published by Investor’s Business Daily that identifies the current top 50 growth stocks.
Let’s take a look at the chart.
Note that the following MarketSurge charts are built with Investors Business Daily’s product suite.
I am an Investors Business Daily (IBD) partner and promote the use of their products. The entire platform offers a good mix of tools, education, and technical and fundamental data.
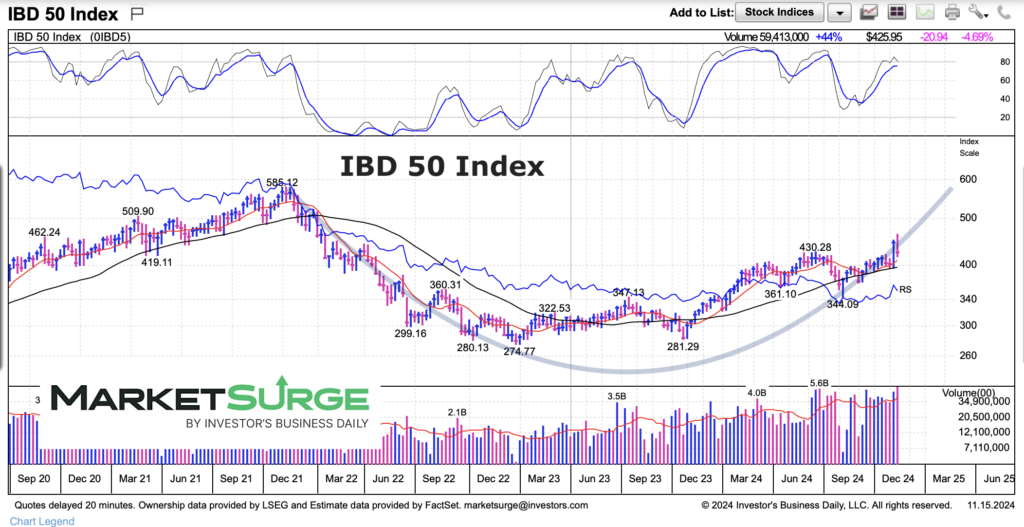
IBD 50 Index “weekly” Chart
As you can see, the IBD 50 formed a nice base after declining from December 2021 to December 2022. from this base, price began to rise early this year. This rally has turned into a more bullish “cup” pattern. Should the IBD 50 continue to rise up the right wall of the cup, it could push above 500.

Twitter: @andrewnyquist
The author may have a position in mentioned securities at the time of publication. Any opinions expressed herein are solely those of the author, and do not in any way represent the views or opinions of any other person or entity.


