The infamous and awesome S&P 500 is actually a subset of the S&P 1500. Sorted generally by the size of the constituent companies, there is a S&P 400 midcap index and a S&P 600 small cap index. S&P 500 + S&P 400 + S&P 600 gets you to the S&P 1500.
Today we look at the small cap index and small cap stocks.
The S&P 600 Small Cap index has done alright over the past couple years, annualizing about 10%. But given the large cap S&P 500 has appreciated by 24% (annualized) during the same period, it has really been challenging to tilt towards small cap stocks.
The more popular Russell 2000 small cap index has had a similar path as the S&P 600.
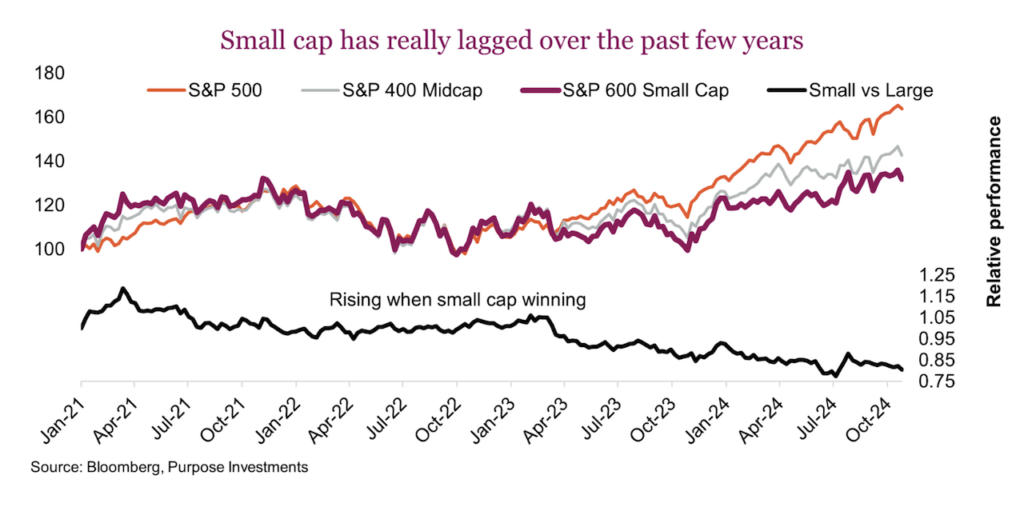
There has been an increased number of questions on size, specifically if this is the time to move down the size spectrum among U.S. equities. And there are some rather compelling and some not so compelling factors to consider:
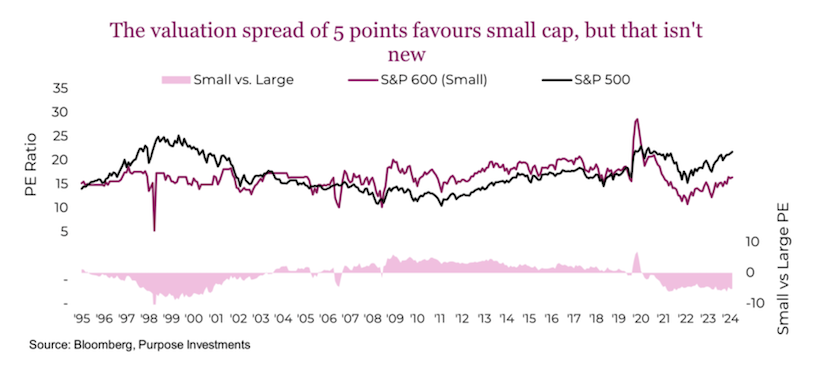
- Valuations (mildly compelling) – The S&P 600 is trading 16.4x forward estimated earnings for the next twelve months, compared to 21.7 for the larger cap S&P 500. That is a pretty high spread, and even more so given small cap usually trades at a premium valuation. However, this isn’t new news. The valuation argument has favoured small cap for the past three years, yet small cap has continued to lag. To be honest, it feels like valuations really have not been a good determinant of performance for the past few years… that will probably change someday.
We don’t put much stock in the relative valuation argument for another reason. Index valuations are calculated by taking the aggregate earnings of the members, based on weight. Small caps typically have more companies with negative earnings, often because they are at an earlier stage in their growth path to maturity. At the moment, 13% of the S&P 600 index members are money losers compared to only 2% for the S&P 500. These money losers detract from the aggregate earnings for the index, and are one of the main reasons small cap usually trades at a premium.
Complicating earnings a little more, today there is a lower frequency of money losers for both the S&P 500 and S&P 600 small cap index, this is one of the reasons for the valuation spread. So valuations support small cap but we wouldn’t put too much stock in this argument.
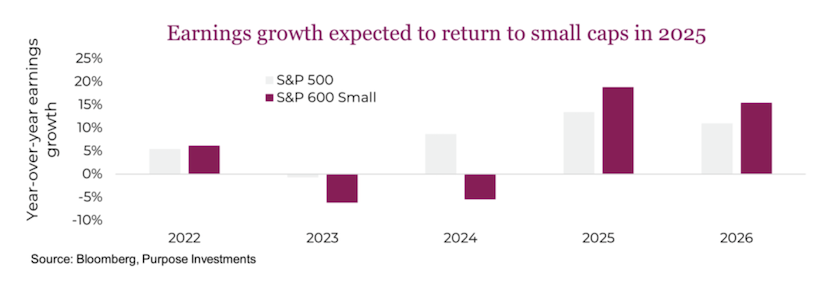
- Earnings growth (compelling) – This does look more encouraging for going smaller on the market capitalization spectrum. In 2022, there was almost no performance difference between the large cap S&P 500 and S&P 600 small cap. Both sucked, down -17% or so as markets fell on inflation/recession/rate fears. 2023 and 2024 (so far), the large-cap has dramatically outperformed small-cap… and look, relative earnings growth really favoured large-cap. This earnings growth advantage is forecast to flip in 2025 & 2026.
Of course, one risk is that those estimates don’t materialize – these are forward consensus forecasts. Nonetheless, the return of earnings growth for smaller companies is a positive factor favouring smaller cap going forward.
- The Fed & tariffs (compelling) – The Fed has started to cut interest rates, as inflation cools. This is good news, more so for smaller companies that are more sensitive to changes in financial conditions. While smaller companies don’t necessarily carry a higher amount of debt, compared to their equity or assets, they just have less flexibility or options when financing or re-financing compared to larger companies. This makes them more sensitive to changing financial conditions. The Fed overnight rate does impact financial conditions, as do many other factors from spreads, equity markets, and generally the availability of credit. Financial conditions have actually been more favourable for the past year+, which clearly hasn’t translated into a lift for small caps… but it is a positive.
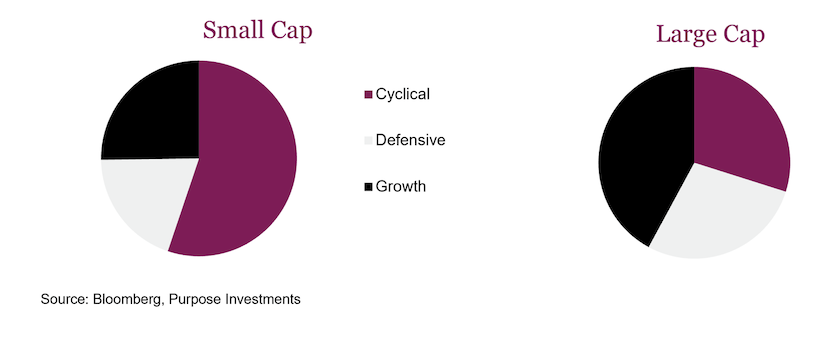
What we don’t know is what trade policies will be enacted. We do know the world continues to move towards more protectionism, a multi-year trend that started with Trump and continued under Biden. A Trump win may kick off another round of tariffs. A Harris win may result in a more gradual move towards more protectionism. Clearly nobody is talking about making trade more free these days. Small caps generate more sales domestically compared to large cap that contain many multi-national companies. The result is more protectionism is favourable for small cap over large cap. It may still be negative, but on a relative basis larger companies are more at risk. - Economic momentum (mixed) – Small caps are more sensitive to the economic cycle and to accelerating or decelerating economic growth. More exposure to the domestic economy certainly contributes to this differentiation, as does the composition of small caps vs large caps. Small caps have a higher weighting to more cyclical sectors including Financials, Industrials, Energy and Materials. While large caps have a higher exposure to defensives including Health Care, Communication Services and Consumer Staples. Plus large cap has a bit more growth mainly from Technology.
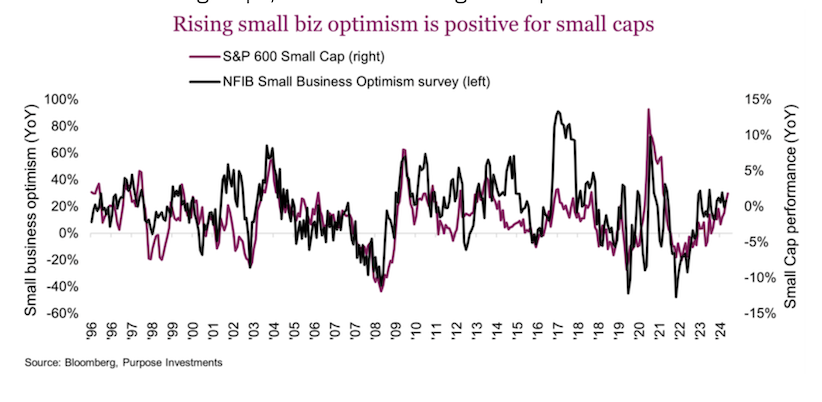
The U.S. economy grew by 2.5% in 2023, with this year expected to finish off around 2.6%. Currently expectations are for a deceleration into 2025 to 1.9%, which is not overly supportive. However, a good trend has been gradually improving small business optimism. The National Federation of Independent Business has a monthly survey and the overall optimism among respondents tracks very well with the performance of small caps. Of course we can’t say if folks will become more optimistic or less going forward, but the improving trend over the past few quarters is encouraging. So too is the economic data during the past couple months which has been consistently coming in better than expected. Perhaps those forecasts for 2025 GDP will be proven too conservative.
Add it all up, we are still a bit mixed on going too far down the size spectrum. For our U.S. equity exposure we remain tilted to more equal weight within the S&P 500 complemented with some market cap exposure and the dividend factor. Overall, this reduces the concentration risk given the size of the megacaps, but remain in larger companies.
Source: Charts are sourced to Bloomberg L.P., Purpose Investments Inc., and Richardson Wealth unless otherwise noted.
Twitter: @ConnectedWealth
The author or his firm may hold positions in mentioned securities. Any opinions expressed herein are solely those of the authors, and do not in any way represent the views or opinions of any other person or entity.


