Treasury bonds and bond yields (interest rates) have been a major investor focus of late.
This is especially true as the Federal Reserve navigates interest rates and the presidential election takes center stage.
Note that the FED lowered interest rates 50 basis points seven weeks ago but bond yields have pushed higher since (with bond prices falling…).
So it’s not surprising that the treasury bond market has been uncertain and difficult to navigate.
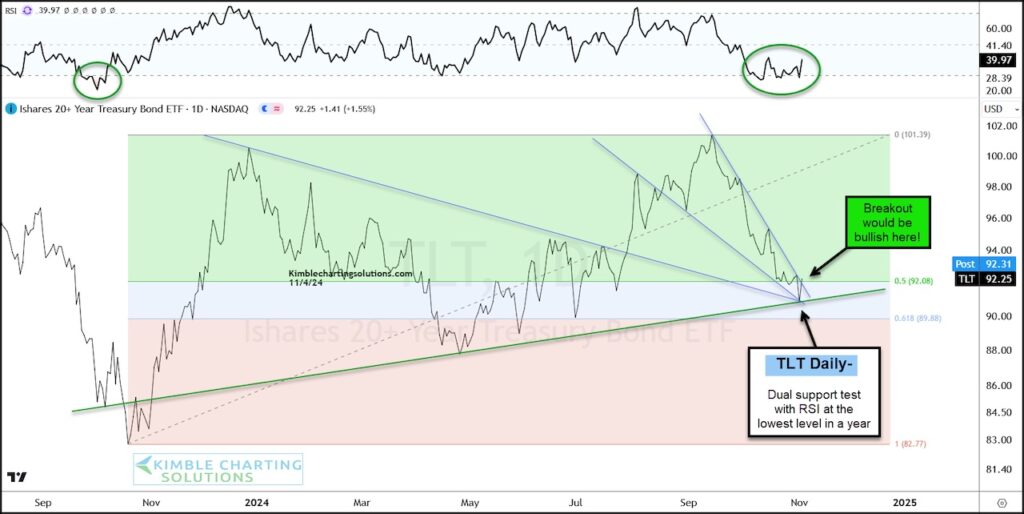
Today, we look at a chart of the 20+ year treasury bond ETF (TLT) where we can see the recent declining price action.
Price has created a falling wedge pattern while testing a major support area. On the upside we have a potential breakout (if higher out of the falling wedge) or a breakdown (if through price support).
Expect volatility here with the election but be mindful of these general parameters for clues on direction. Stay tuned!
$TLT 20+ Year Treasury Bonds ETF Chart

Twitter: @KimbleCharting
The author may have a position in mentioned securities. Any opinions expressed herein are solely those of the author, and do not in any way represent the views or opinions of any other person or entity.


