The US Dollar is the world’s reserve currency and, as such, it garners a lot of attention from traders, investors, and media.
Out-sized moves in the US Dollar can lead to moves in all asset classes. For example, commodities like gold and oil are affected by a stronger or weaker Dollar.
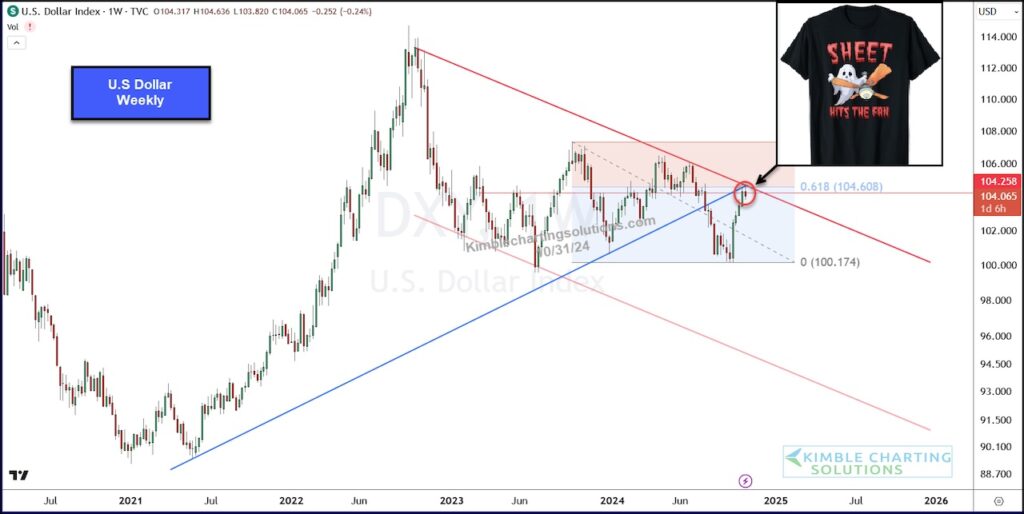
Today, we look at a “weekly” chart of the US Dollar Index to highlight why it has reached a critical point.
As you can see, King Dollar has been in a broad falling price channel since 2022. Within that channel, the Dollar fell below its blue up-trend line before rallying back to test the underside of it over the past two weeks.
Note that this area of resistance also includes the top of the falling channel and the 61.8 Fibonacci level.
This looks like pretty strong resistance that could lead to further weakness (gold bulls sure hope so). Only a breakout would foil bears plans to take the Dollar lower.
U.S. Dollar Index “weekly” Chart

Twitter: @KimbleCharting
The author may have a position in mentioned securities. Any opinions expressed herein are solely those of the author, and do not in any way represent the views or opinions of any other person or entity.


