The stock market performs best when risky assets are being bought by investors. This is what investors call “risk on”, as it points to the animal spirits that often fuel bull markets.
Today we highlight one of those risky assets (junk bonds) and compare it to the S&P 500 broad stock market index. And what we see is strong reason for caution here in the market.
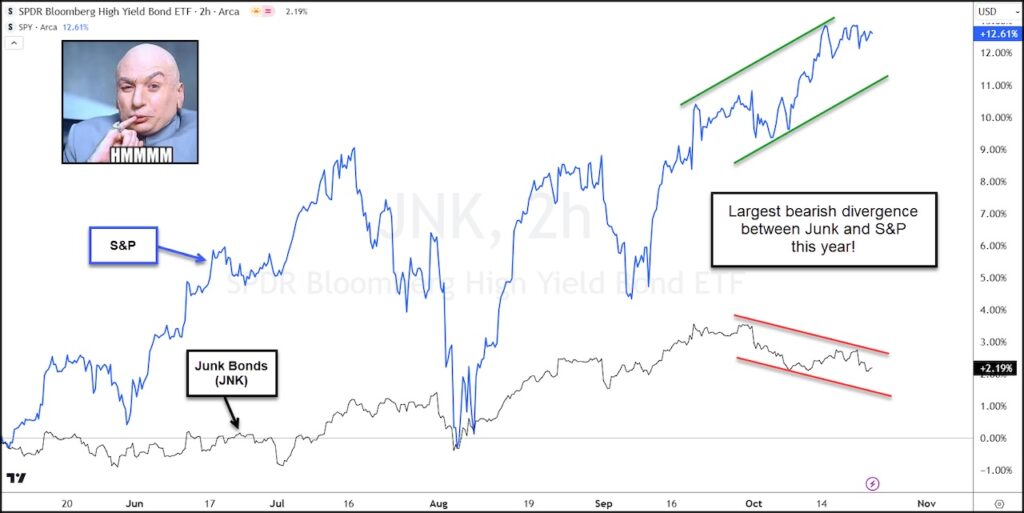
Below is a chart highlighting the year-to-date performance of the S&P 500 etf (SPY) versus the Junk Bonds etf (JNK).
What jumps out to me on the chart is the monster bearish divergence occurring right now. In fact, it’s the largest/longest bearish divergence of the year.
If investors are selling a risky asset like junk bonds, will stocks be next? Stay tuned!
Junk Bonds versus S&P 500 Bearish Divergence Chart
Twitter: @KimbleCharting
The author may have a position in mentioned securities. Any opinions expressed herein are solely those of the author, and do not in any way represent the views or opinions of any other person or entity.
: Creating Bullish Divergence?")


 and Semiconductors (SMH): Concerning Price Pattern?")


