I have commented but not focused too much on the Biotechnology Sector ETF (IBB).
My weekend comments were, “IBB remains stuck in its weekly trading range. Remember, the longer the range sustains, the better the move out of it tends to be. IBB gets interesting over 150.”
So what about that trading price range and current trading levels?
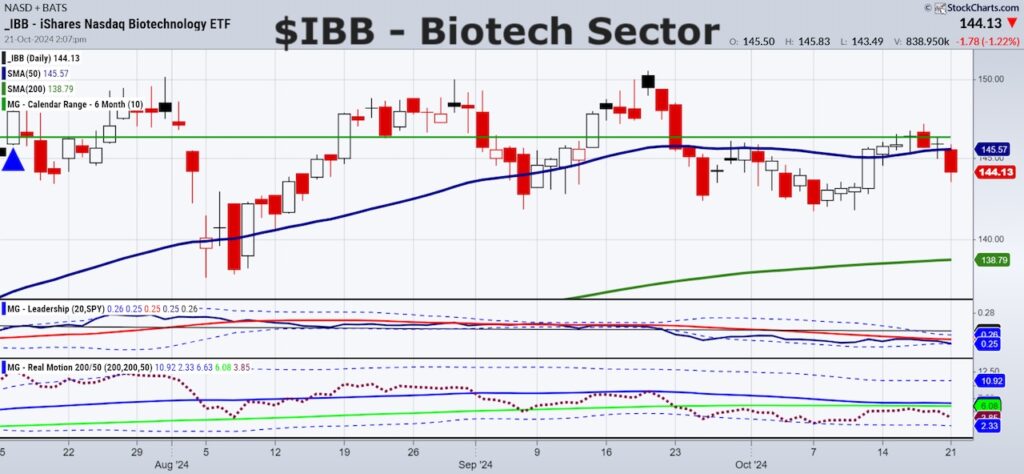
The daily stock chart of IBB has several technical indicators.
- Price in candlesticks.
- The July 6-month calendar range high and low (green and red horizontal lines).
- The 50 and 200-day moving averages (blue and green).
- Triple Play or Leadership Indicator.
- Real Motion or Momentum Indicator.
I like to focus on the biotechnology sector (IBB) as the weather gets colder.
I went to Costco this weekend, and the checkout person overheard me talking about buying toilet paper, or not buying it as they were out of Charmin.
She said, “You should buy what we have since its amazing if we have anything left as the return of Covid has folks hoarding the stuff again.”
What resonated with me was not the public hoarding mentality, but rather, the return of winter ills and chills.
What does this mean for Biotechnology stocks (and I guess toilet paper as well)?
In the list of indicators, I want to draw your attention to leadership.
From July until early August, the biotechnology ETF (IBB) was outperforming the benchmark.
Since then, the S&P 500 ETF (SPY) has well outperformed.
While the price has not done too badly maintaining a trading range between 142-150, I am seeing that that wall of support since early August at 142 could be key.
Currently, IBB trades beneath the July calendar range high.
It has begun the week under the 50-DMA.
Momentum with the red dots under the 50 and 200-Day Moving Average shows a bearish divergence.
Yet, something about the chart looks compelling.
Clearly a breakout over 150 could be a game changer.
In the meantime, watch 142 to hold.
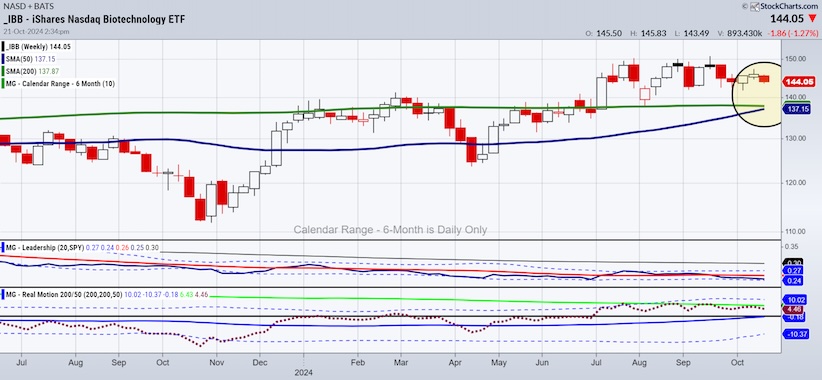
And have a look at this:

The last time IBB had a weekly golden cross was in 2017. After that the bull phase on the weekly charts lasted until October 2022 or exactly 2 years ago.
Now, a golden or bull cross looks like it’s ready to reemerge -with the price not too far from the moving averages for a relatively low risk.
Stock Market ETFs Trading Analysis & Summary:
(Pivotal means short-term bullish above that level and bearish below)
S&P 500 (SPY): 575 support 585 resistance
Russell 2000 (IWM): 215 support 227 resistance
Dow Jones Industrials (DIA): 435 next? If holds 425
Nasdaq 100 (QQQ): 485 pivotal support 500 resistance
Regional Banks (KRE): 60 pivotal
Semiconductors (SMH): 242 support 265 resistance
Transportation (IYT): 69.50 support
Biotechnology (IBB): 142 support zone 146.50 resistance
Retail (XRT): 78.99 would be the highest monthly close since 2022
iShares High Yield Bond ETF (HYG): 79.50 nearest key support
Twitter: @marketminute
The author may have a position in mentioned securities at the time of publication. Any opinions expressed herein are solely those of the author and do not represent the views or opinions of any other person or entity.


