Though I don’t often rely on volume indicators in my analysis, understanding volume is crucial because it reveals market dynamics that price alone can’t capture.
In this video, I delve into why we need to look at volume, starting with early methods like Joe Granville’s on-balance volume. While groundbreaking at the time, his approach had limitations in accurately measuring volume’s impact.
This leads us to the Chaikin Money Flow, developed by Mark Chaikin, which stands out for its ability to identify market trends, especially potential tops.
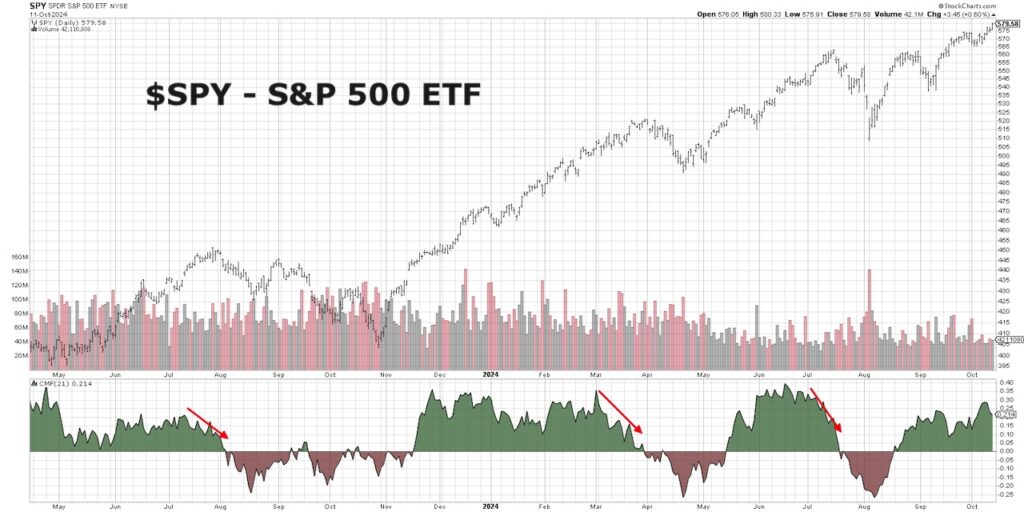
Let’s use the S&P 500 as an example. The Chaikin Money Flow has previously signaled significant market tops by showing bearish divergences—situations where the indicator trends lower while the price trends higher.
Historically, such divergences have indicated approaching market peaks, making this a crucial chart to watch as we move through Q4 2024. While we haven’t seen a divergence yet, staying alert for this signal is essential for anticipating major market shifts.
- How did the evolution of dark pools, electronic trading, and decimalization affect the validity of traditional volume indicators?
- What makes the Chaikin Money Flow more reliable than traditional volume analysis in identifying market tops and bottoms?
- How has the Chaikin Money Flow previously signaled major tops in the S&P 500, and what should we watch for in Q4 2024 to anticipate a similar event?
Video: A Closer Look at the Chaikin Money Flow Volume Indicator
S&P 500 ETF with Chaikin Money Flow Indicator Chart
Twitter: @DKellerCMT
The author may have positions in mentioned securities at the time of publication. Any opinions expressed herein are solely those of the author, and do not in any way represent the views or opinions of any other person or entity.
: Creating Bullish Divergence?")


 and Semiconductors (SMH): Concerning Price Pattern?")


