China-the US has tried to sanction the country into irreparable hardship.
But China moves along regardless.
China has shifted gears to increase domestic production.
Huawei is one example of a company that sanctions left practically bankrupt, that now has soaring revenues.
With the help of the Chinese government, that company and others are benefitting from a blend of state-run incentives and private and innovative entrepreneurship.
Huawei and China are now top producers of
Smart Phones
EVs
Automated Shipping
Clean Energy
Plus, China is looking to lead in nuclear fusion and biotechnology.
Centuries ago, China was 25% of the global GDP. Today, Chinese policymakers would like the GDP to grow back to 5% and beyond.
In September, the Peoples Bank of China unveiled its biggest stimulus since the pandemic.
Saturday October 12, China’s Ministry of Finance is set to hold a briefing expected to deliver up to 2 trillion yuan, or about $282 billion, in fiscal stimulus.
Is that enough? Is China becoming the next huge investment opportunity?
There are those like Michael Burry who say yes, while others like Ray Dalio say no.
Thinking logically, China’s recent rounds of stimulus to boost the economy makes sense.
In progression, adding liquidity to the investment side of the economy and stabilizing the bond market, then boosting the real estate side by improving home sales as well as Chinese property developers’ sales-all makes sense.
Making sure 1.4 billion have their energy needs met, (China far ahead in solar, EVs, automation).
And making sure their food needs are met, (grain prices have risen from the August lows).
Commodities set to benefit, is a topic for another time.
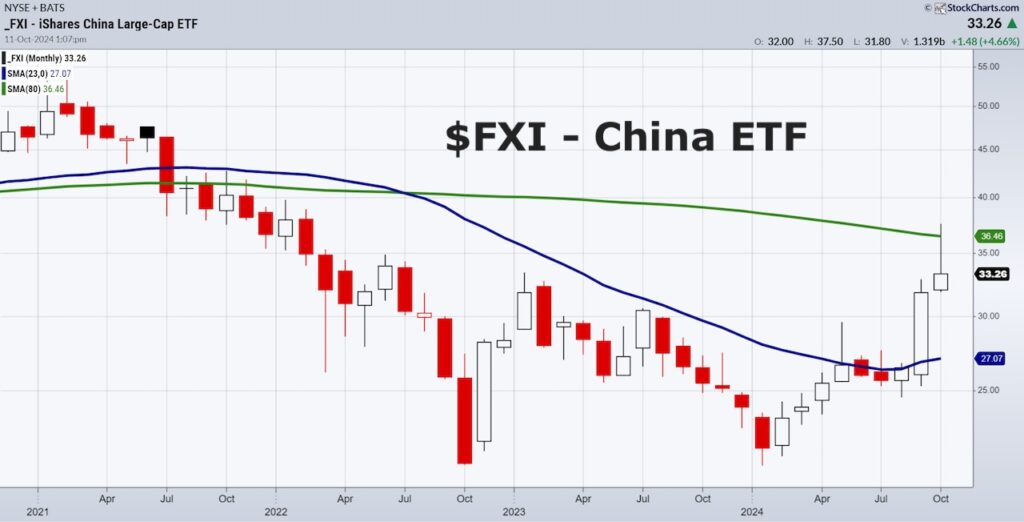
The monthly chart of FXI (a reliable broad-based Country ETF) shows that in August, after over 3 years of a sell-off, the price cleared the 23-month moving average or expanded back into a 2-year business cycle.
Note that the price stopped dead in its track at the 80-month moving average or 5–6-year business cycle.
That is the next point to watch to clear.
What about the top US traded Chinese companies?
Looking out to both the weekly and monthly charts on Alibaba (BABA), Baidu (BIDU) and JD.com (JD), planning for the longer term is clear.
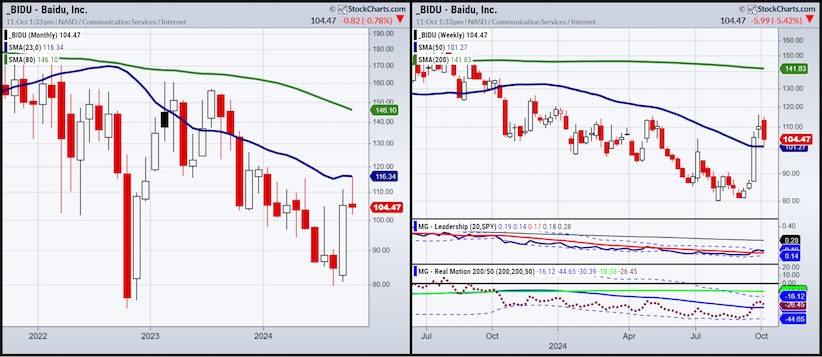
Baidu BIDU, on a monthly basis is underperforming FXI.
That means a clearance of the 23-month moving average could be a great buy opportunity.
The weekly chart shows it now in a recuperation phase.
BIDU outperforms SPY and momentum is on par with price.
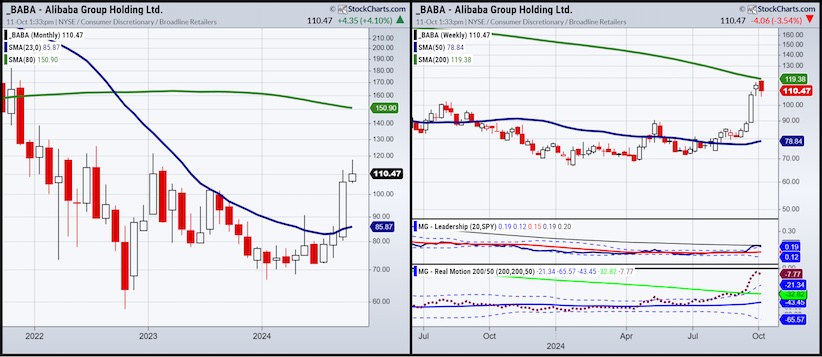
Alibaba BABA needs to clear the 200-week moving average (green) and if it does, the trip to the 80-month MA (also green) or to $150 could be swift.
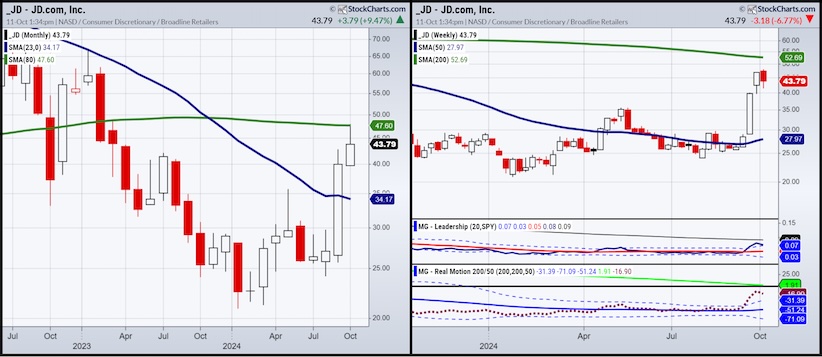
JD.com (JD)’s price action looks the most like the price action of FXI.
We are watching not only the 80-month MA to clear signifying a broader rally in store, but also the 200-week moving average.
The area between $47-53 is the resistance to get over.
Whatever stimulus is announced this weekend, President Xi has expressed that the even bigger guns could happen after the US election.
That also makes sense as the US continues to politicize during the Presidential campaign, its plans with China.
Stock Market ETFs Analysis & Summary:
(Pivotal means short-term bullish above that level and bearish below)
S&P 500 (SPY): 572 support 595 resistance-5800 first time!
Russell 2000 (IWM): Range 215-225
Dow Jones (DIA): New all-time highs again
Nasdaq 100(QQQ): 485 pivotal support 400 resistance
Regional Banking (KRE): 58 is the 200 week MA to hold
Semiconductors (SMH): 248 support 257 resistance
Transportation (IYT): 71.16 all time high Friday high got close
Biotechnology (IBB): 142 support zone 146.50 resistance
Retail (XRT): 75 pivotal support 78 resistance
iShares High Yield Core Bond ETF (HYG): Back trading at 79.50-watching this coming week to see if market frothy
Twitter: @marketminute
The author may have a position in mentioned securities at the time of publication. Any opinions expressed herein are solely those of the author and do not represent the views or opinions of any other person or entity.
: Creating Bullish Divergence?")


 and Semiconductors (SMH): Concerning Price Pattern?")


