Investors have had a great year in equities, with the S&P 500 seeing big gains.
And it looks like the S&P 500 may have a bit more upside as long as trend indicators remain in tact.
So how much higher?
Good question. Today we highlight two patterns to help identify two potential upside price targets.
Note that the following MarketSurge charts are built with Investors Business Daily’s product suite.
I am an Investors Business Daily (IBD) partner and promote the use of their products. The entire platform offers a good mix of tools, education, and technical and fundamental data.
S&P 500 Index Price Chart
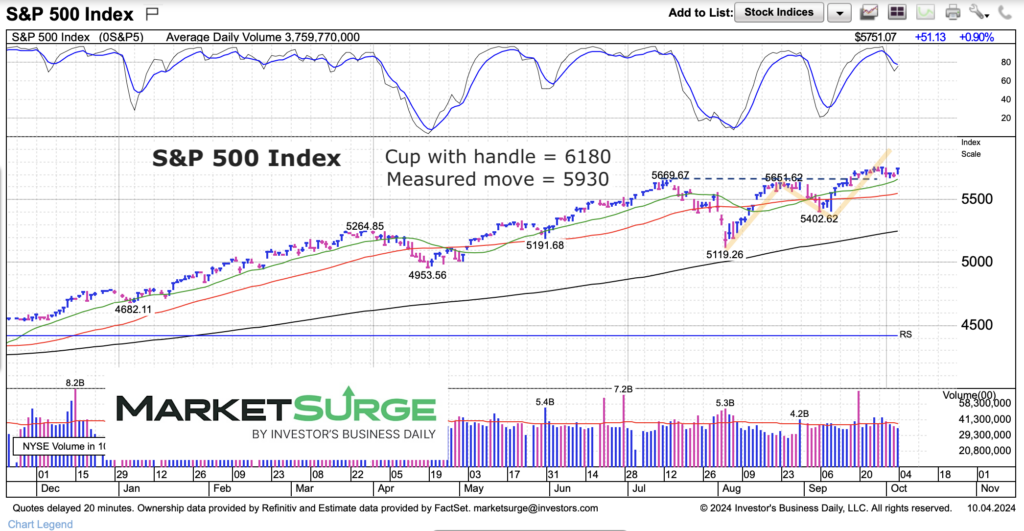
The S&P 500 Index surpassed its July/August highs looks poised for more gains… as long as momentum indicators don’t breakdown. In the chart below. I highlight two price patterns that could be fueling higher prices. The first is a cup with handle that measures all the way up to 6100+. The second pattern is a measured move pattern that measures up to 5930.
These are areas I’ll watch closely if price remains strong and the breakout sees follow through buying.
Twitter: @andrewnyquist
The author may have a position in mentioned securities at the time of publication. Any opinions expressed herein are solely those of the author, and do not in any way represent the views or opinions of any other person or entity.


