Investors are being greeted with volatility as we start October… or Rocktober.
And things are certainly rocking, making it feel like the late 1970s all over again.
Eerily the port strike last happened in 1977.
Today is President Carter’s 100th birthday.
The Middle East is unstable and WTI oil is back over $70.
The Federal Reserve has started adding liquidity.
Recent weather patterns along with geopolitics impacting sugar.
We appear to be between 1977-1978 in terms of trough in CPI about to turn…
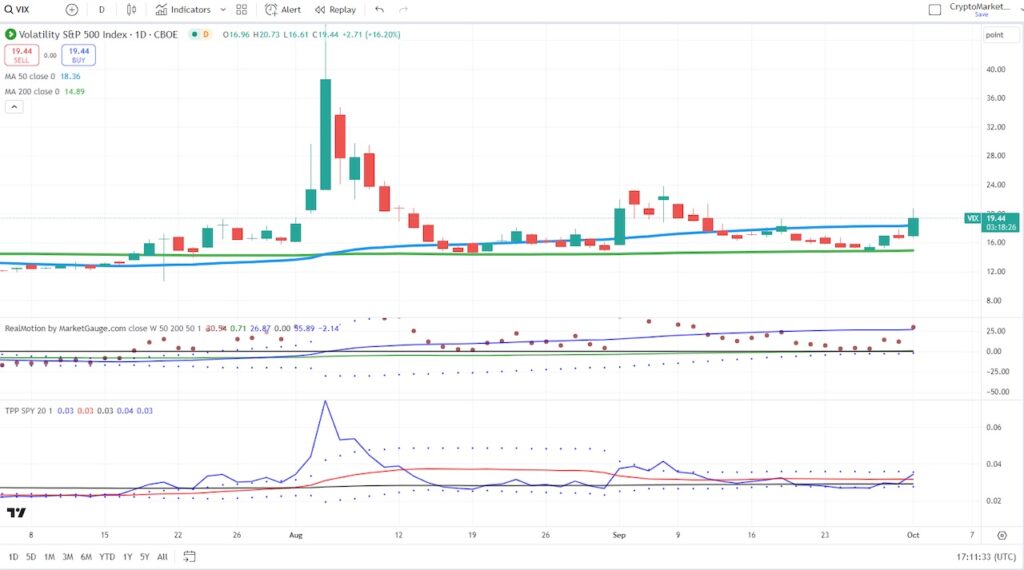
Good time to look at the turnaround in volatility.
The Daily chart shows that the price is trying to clear above 50 daily moving average.
The momentum is above the 50-DMA and increasing.
And the leadership has flipped in favor of Volatility over SPY.
Will that sustain?
Zooming out to the weekly charts:
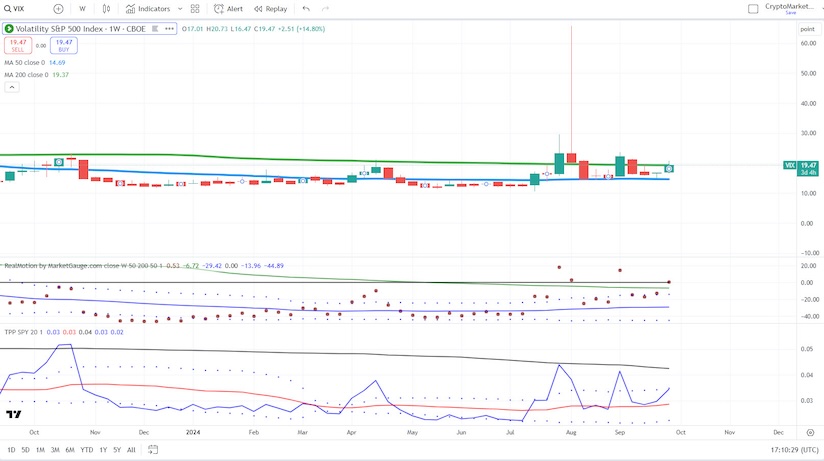
The weekly chart shows some resistance against the 200-week moving average (green line).
Is that comforting?
Only if the price remains below that key resistance.
If the volatility picks up from here, we are looking at another even scarier potential-
The monthly chart, which shows price back into a 2-year expansion, is threatening to clear the 80-month moving average or a longer business cycle expansion.
That would mean more volatility like what we saw in 2022, only for very different reasons.
Keep your eyes on 20.25 as this month continues-that is the biggest overhead resistance bulls do not want to see clear.
Twitter: @marketminute
The author may have a position in mentioned securities at the time of publication. Any opinions expressed herein are solely those of the author and do not represent the views or opinions of any other person or entity.
: Creating Bullish Divergence?")


 and Semiconductors (SMH): Concerning Price Pattern?")


