This week, we’re highlighting some key data points on stock market performance during presidential election seasons.
What you’ll find is a generally positive outlook on how markets respond, with some variation depending on which party takes office. We’ve also taken it a step further by looking at market cap sizes, showing that small caps tend to outperform their large-cap peers during these periods.
- Election Year Stock Market Ramp
Stock Market ramps higher post election… - Republican Winner vs Democrat
Both do well with some differences… - Small Caps Outperform
20% returns historically post election
#1 Historically Market Ramps Post Election
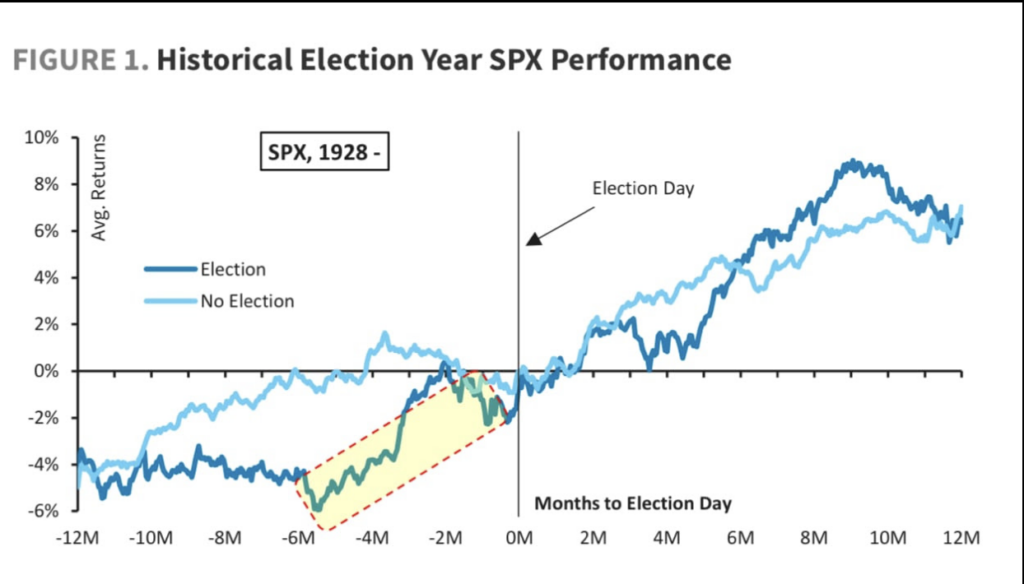
The chart above illustrates stock market performance 12 months before and after an election, compared to non-election years and typical seasonality (source: Barclays). During election years (dark blue), markets tend to rally in the months leading up to the election, stabilize, and then push higher 3-9 months afterward. This aligns with the idea that markets dislike uncertainty, and once the election is over, participants can better navigate the environment with more clarity.
#2 Republicans Perform Better Right After but Democrats Ramp After…
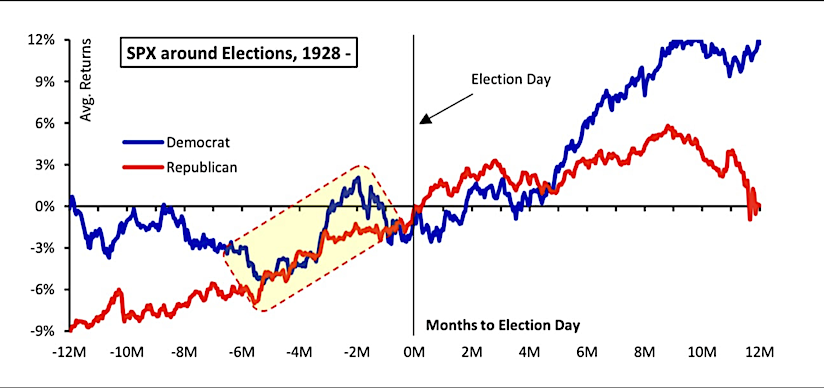
This next chart highlights market returns based on political party outcomes (source: Barclays). While there are many ways to interpret this data, choosing the timeframe can provide a variety of outputs. Since 1928, markets have tended to perform well in the four months following a Republican win, whereas after a Democratic victory, markets generally see stronger performance from the election date through the following 12 months.
#3 Small Caps Lead the Way 1 Year Post Election
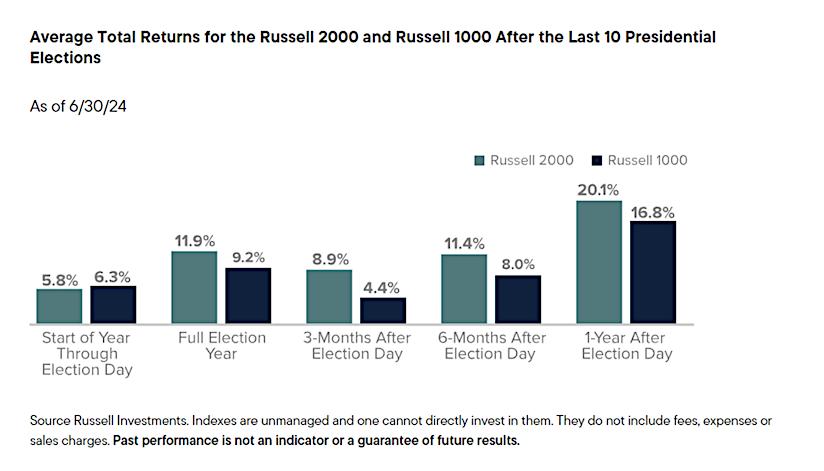
Lastly, when comparing small caps to large caps, it’s clear that small caps tend to outperform during election years—particularly six months and one year after Election Day. This is especially relevant for our portfolio, as we believe the best opportunities lie within mid- and small-cap companies today, ranging from $1 to $15 billion in size. Historically, these companies have delivered a 20.1% return in the 12 months following an election.
Twitter: @_SeanDavid
The author and/or his firm have positions in the mentioned companies and underlying securities at the time of publication. Any opinions expressed herein are solely those of the author, and do not in any way represent the views or opinions of any other person or entity.
: Creating Bullish Divergence?")


 and Semiconductors (SMH): Concerning Price Pattern?")


