I’d say “if the Economic Modern Family could speak…”
However, they can, and they do.
And what are they saying after a week of China flying, metals rallying, yields and dollar flattening, natural gas bottoming and oil prices dropping?
Not too much….YET!
Let’s examine the weekly charts.
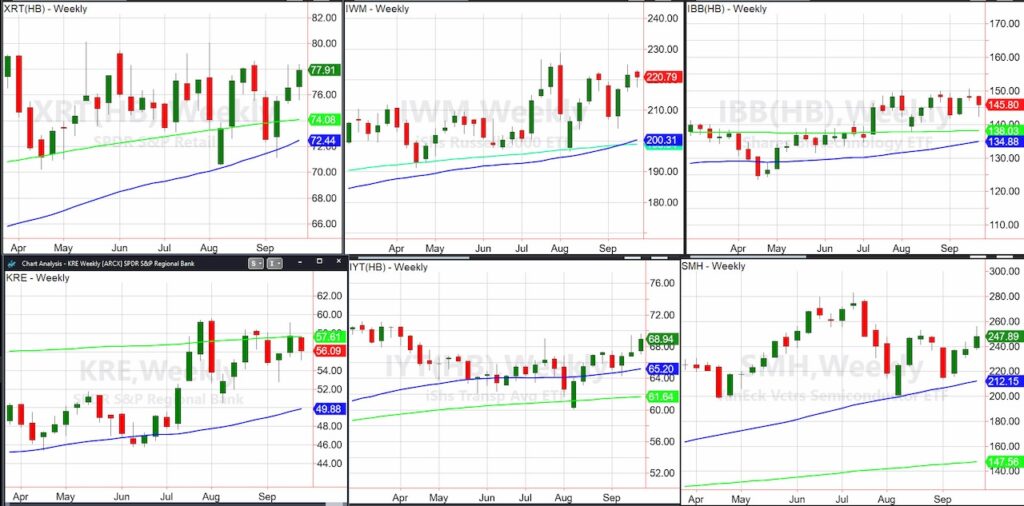
The Retail etf XRT, if you did not see it, the Daily early last week featured a channel that needs to be watched carefully.
The high to low price of this past week was within the high to low price of the week prior (inside week).
The green candle though, shows XRT closed higher on the week.
Hence, the channel remains intact and the longer the better when it finally reconciles.
The Russell 2000 etf IWM also had an inside trading week. Similarly, at some point that trading range will reconcile, and man, will we be ready.
Biotechnology etf IBB sits proverbially, stuck in the middle, albeit at the top of the 2024 range.
The Semiconductors etf SMH outperformed this past week. But, if you look at the weekly chart, SMH is just in the middle of the range from the lows at 200 and the highs at 280.
Like XRT, IWM, and SMH, this pause in the action is exciting as when any or all of them move, there will be lots of opportunities.
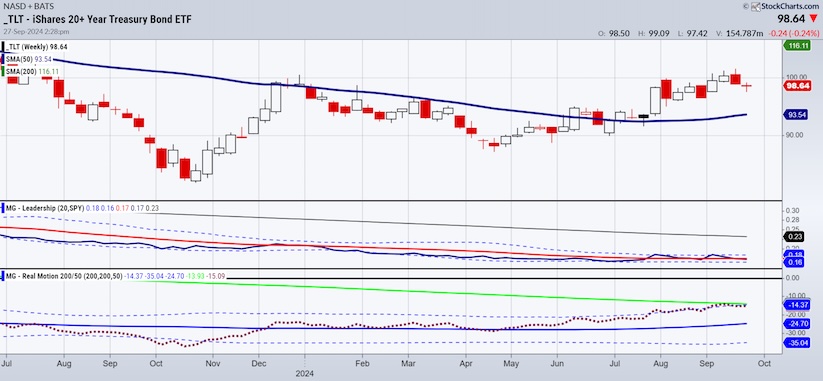
Before we look at the last 3 members, here is a reminder from another Daily this past week on the long bonds etf (TLT):
“A rally in TLT and a potential outperformance of the benchmark could be negative for the dollar and equities, while positive for emerging markets and commodities.”
Looking at the weekly chart of TLT, keep your eyes on the performance versus SPY.
And watch the momentum indicator now looking like a bullish divergence.
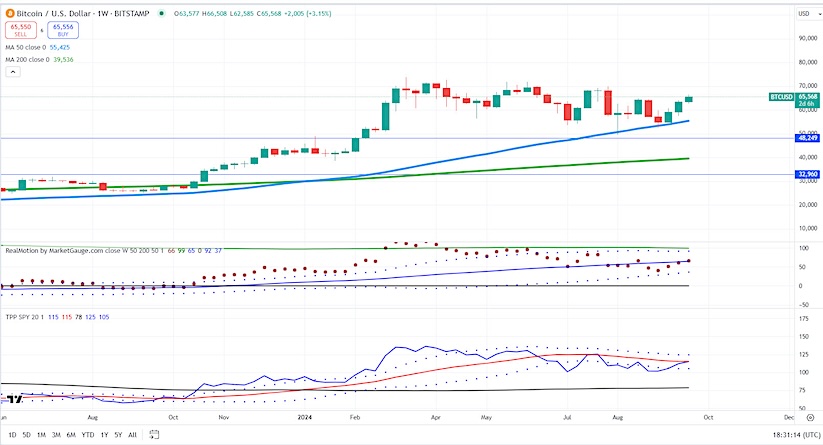
Speaking of improving momentum and leadership, behold the weekly chart of Bitcoin.
Not quite there yet, we will watch BTCUSD to see if it continues the drive above 65,000 and how it does compared to SPY.
Transportation, IYT closed higher on the week as well.
With some overhead resistance in its path, we are encouraged that IYT is showing some leadership at this stage.
As we know, IYT can lead the “inside” sectors higher.
Finally, the Regional Banks etf KRE never made it back over the 200-Week Moving Average (green line).
Yet, just like the rest of the gang, the trading range holds up.
With pretty much everyone still meandering and not showing much direction since July, I remind you again-
Watch the long bonds. They could shake up these etfs in all kind of ways!
Twitter: @marketminute
The author may have a position in mentioned securities at the time of publication. Any opinions expressed herein are solely those of the author and do not represent the views or opinions of any other person or entity.
: Creating Bullish Divergence?")


 and Semiconductors (SMH): Concerning Price Pattern?")


