This week we want to alert readers to a potential reversal signal that may be forming in the context of two of the major U.S. equity indices.
Although the S&P 500 is making a new high this week and might even have more room to climb, the NASDAQ 100 has been unable to make a new high. It is also printing an Elliott wave pattern that would be consistent with a downward reversal.
It’s worth noting that a similar event happened at the end of 2021 which preceded a substantial decline.
That said, do not get bearish prematurely. A lower high in the NASDAQ would be one piece of evidence that a reversal is taking place, but it is not sufficient to make the case on its own. For better confirmation of a trend change, we would also need to see the S&P 500 begin losing successive supports and forming a series of lower highs. The potential intermarket divergence appearing right now is merely an early warning sign that might or might not be borne out by the next developments in the charts.
Using the Invesco QQQ Trust Series 1 ETF (NASDAQ:QQQ) to stand in for the index, our examination of price action during the past three years leads us to believe that a major upward move (an Elliott wave impulse) may have concluded its series of five waves in November 2021. Provisionally we view the subsequent price action as a pair of large corrective swings [a] and [b], which should be followed by another downward swing [c].
Although there is more than one way to count and label the smaller structures within those swings, we’ve chosen the wave count that seems the best fit.
Regardless of the internal structures, the price range of the downward-trending move that we label as [a] has a nice 1:1.618 Fibonacci ratio to the upward-trending move that we label as [b]. Resistance near 504 represented the ideal target for a tall [b] wave.
If QQQ remains beneath 504 while the S&P retreats from its newly printed high, then some in the market will interpret it as a bearish signal.
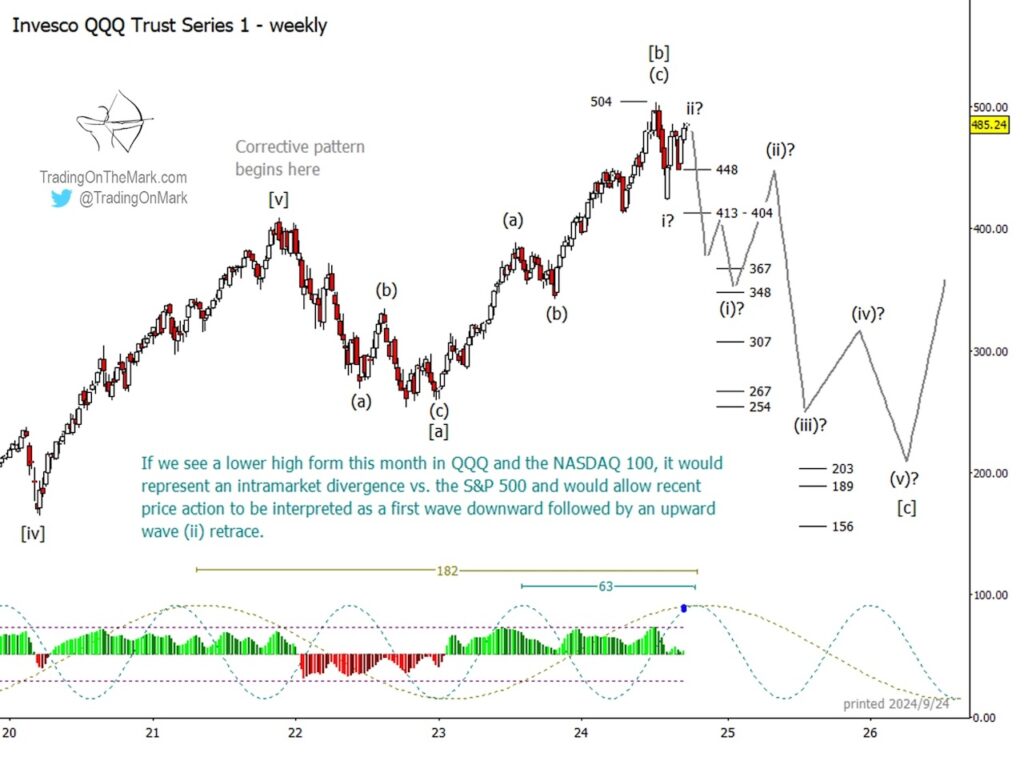
Our wave count on the weekly chart allows the recent down-up moves to be interpreted as downward wave (i) and upward retracing wave (ii), as long as price stays beneath 504. If that bearish count becomes invalidated with a new QQQ high, then the next prominent areas of resistance would be from 504 to 507 and at 526 based on Fibonacci techniques.
We note that price is currently testing 486, which is the Fibonacci 78.6% retracement of the down move labeled as (i). That area would be a good place for the rally to stop, if it’s going to stop.
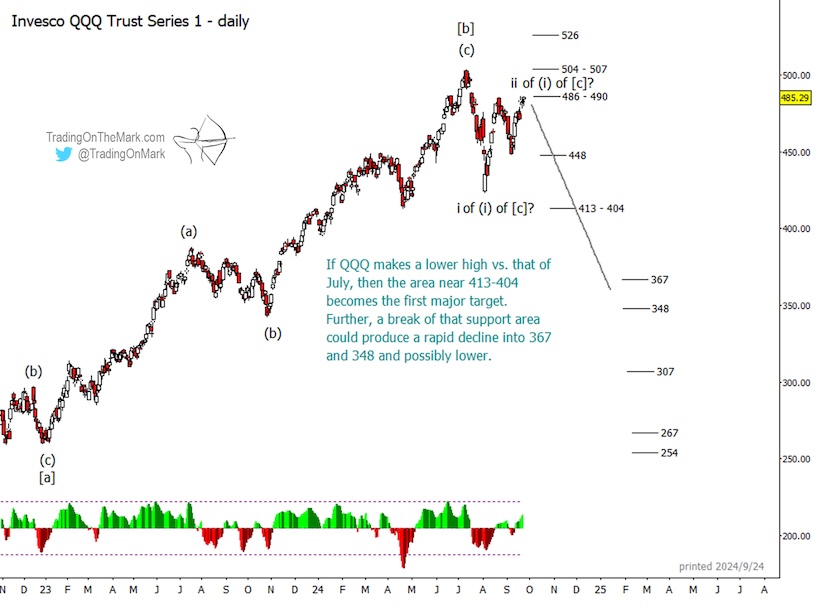
If a decline takes place from nearby, then support near 448 represents the first obstacle for bears, with a greater obstacle near the 413-404 area. If the latter support breaks, then the market might make a quick trip to next supports near 367 or 348. Beyond that, we’d want to see more structure printed on a daily chart before choosing the next near-term targets.
Some appealing targets for the entirety of declining wave [c] are near the area of the “COVID low” in 2020, with specific supports waiting near 203, 189 and 156. However, it’s premature to say that a decline will reach that far even if it turns out to be a [c] wave. First, we want to see the market start forming a strong downward wave (iii) of [c] and note how far bears are able to push it. After that we’ll have a better sense of the targets for a subsequent downward leg (v) of [c].
At the eventual end of declining wave [c] there should be a very good buying opportunity.
Elliott wave analysis identifies the places where the market is more likely to turn, as well as the possible target destination of a move. It also shows where price specifically should not go if the main scenario’s thesis is true. For a trader to make use of these “if this, then that” types of scenarios, it’s helpful to have guidance from people who have already integrated Elliott wave into their trading.
Our newsletter follows the S&P 500 and related markets on weekly and daily time frames. Now that the trading season is in full swing, Trading On The Mark is offering a subscriber special with 20% off. You can also inquire about our intraday service, which is more customized.
Twitter: @TradingOnMark
The authors may have a position in the mentioned securities at the time of publication. Any opinions expressed herein are solely those of the author, and do not in any way represent the views or opinions of any other person or entity.


 Pressuring Lower Price Support")


 Pressuring Lower Price Support")