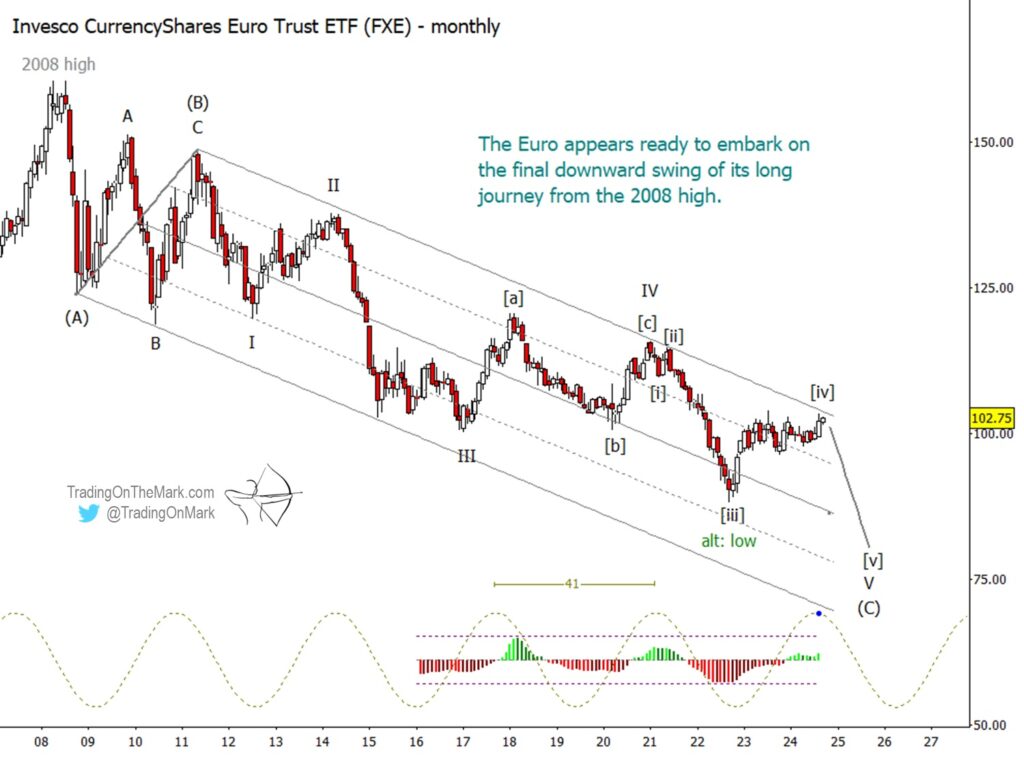
The Euro has remained in a consolidation zone since we last wrote about it in April, but we think nearby resistance will be difficult to beat. Its easiest path would be to resume the jagged downward journey it has followed since 2008.
Should this scenario unfold, then the Euro would likely make a new low sometime within the next two years.
With this in mind, bullish traders should be especially wary while bearish ones should watch for signs of reversal.
Here we again use the Invesco CurrencyShares Euro Trust ETF (NYSEARCA:FXE) to stand in for Euro currency futures. Although there are some minor differences in the wave structures that the two markets have produced over the timespan shown on the monthly chart below, FXE still follows the Euro fairly closely on weekly time frames and faster. Also FXE produces nice geometry and fibonacci ratios on a chart.
Right now FXE is pressing against a combination of channel geometry and Fibonacci-related resistance levels that exist from 102.80 to 104.30. Bears will probably find it easiest to catch a downward trade if price stays beneath the July 2023 high of 103.84, although a downward reversal from the 104.30 area would produce the same effect with slightly different implications for the wave count. Regardless of which level gets tested, a local high nearby would match well with the peak phases of the two strongest price-time cycles which have periods of 59 weeks and 86 weeks.
On the weekly chart there is some ambiguity in the wave count even within the primary scenario that we depict with black labels. It’s not clear whether wave [iv] actually finished in 2023 or whether it needs one more high this year to reach completion. Thus we have marked two spots that could represent the termination of [iv].
If price rises above 103.84 in the near term, it would mean that wave [iv] is still unfolding at the moment even though it might be on the verge of ending. In that case, bulls should still be wary and bears should still watch for technical signs of a reversal. Also wave [iv] could conceivably reach as high as 109.74 without breaking the main wave count, although we think it’s more likely that a reversal will take place from lower.
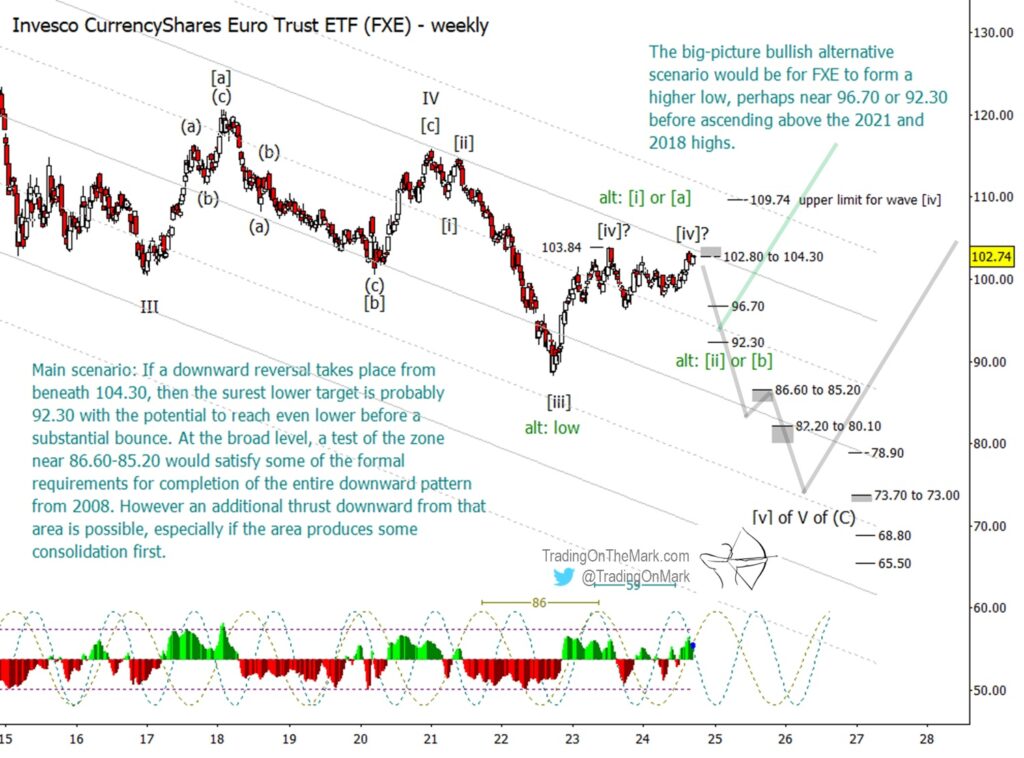
If the expected downward move kicks in, there’s still an opportunity for price to make a higher low as part of the alternative scenario shown with green labels and the green path. Areas near 96.70 and 92.30 represent the most likely spots for that higher low to set. At the moment we believe the alternative bullish scenario is much less probable than the bearish one, but anyone on a short trade would want to monitor those areas when they are tested.
If 92.30 breaks as support then the market might see a quick drop to the area near 86.60-85.20 as bulls throw in the towel. Beneath that zone, the path we have drawn is more speculative. It will be necessary to revisit the FXE charts on weekly and possibly daily time frames to determine what kind of downward structure is forming. Right now it’s difficult to say which of the lower support zones would mark the eventual end of [v] of ‘V’ of (C), which would also represent the end of the entire decline from 2008. We will post updates as the pattern develops.
Elliott wave analysis identifies the places where the market is more likely to turn, as well as the possible target destination of a move. It also shows where price specifically should not go if the main scenario’s thesis is true. For a trader to make use of these “if this, then that” types of scenarios, it’s helpful to have guidance from people who have already integrated Elliott wave into their trading.
Our newsletter follows the Euro and related charts on weekly and daily time frames. Now that the trading season is in full swing, Trading On The Mark is offering a subscriber special with 20% off. You can also inquire about our intraday service, which is more customized.
Twitter: @TradingOnMark
The authors may have a position in the mentioned securities at the time of publication. Any opinions expressed herein are solely those of the author, and do not in any way represent the views or opinions of any other person or entity.


