Retail stocks have been an under-performing S&P sector for some time.
So the question now is, will this continue… or is the Retail Sector (XRT) nearing an important breakout?
As usual, a good chart can tell the story.
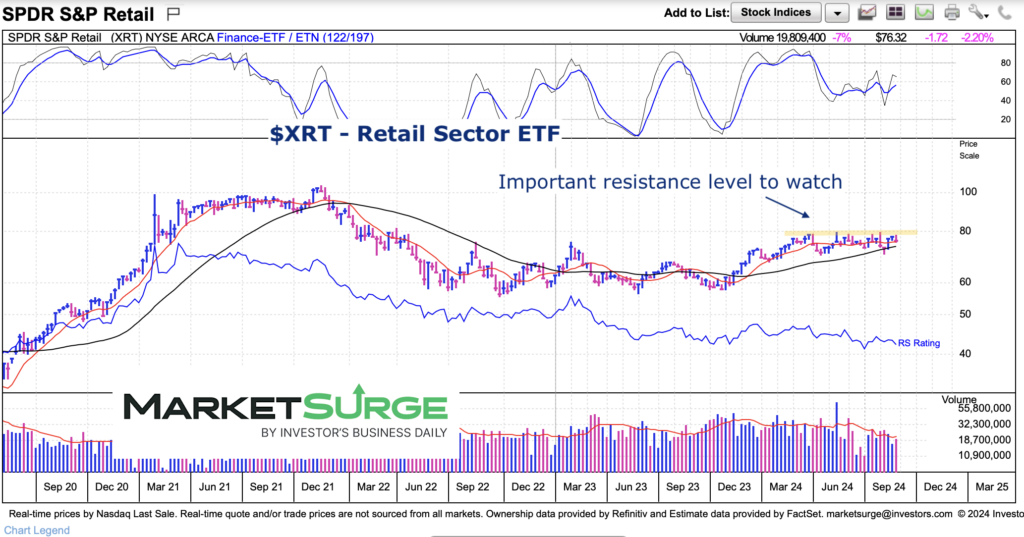
Today we look at an intermediate term “weekly” chart of the Retail Sector ETF (XRT) to highlight an important price level for investors to watch.
Note that the following MarketSurge charts are built with Investors Business Daily’s product suite.
I am an Investors Business Daily (IBD) partner and promote the use of their products. The entire platform offers a good mix of tools, education, and technical and fundamental data.
$XRT Retail Sector ETF “weekly” Chart
We are keeping it really simple today. $80 has been resistance all year and until XRT can breakout over that level, it will remain in no man’s land.
It’s probably also good to watch the $80 level for clues to the economy… especially as we head into end of year and holiday season.

Twitter: @andrewnyquist
The author may have a position in mentioned securities at the time of publication. Any opinions expressed herein are solely those of the author, and do not in any way represent the views or opinions of any other person or entity.


