The price of gold has been on a tremendous run higher 2024, most notably passing the $2500 price per ounce.
The rise in gold prices has led to a strength in gold and gold mining stocks.
Some have been outright bullish like Agnico-Eagle Mines (AEM), while others have been more subdued like Barrick Gold (GOLD).
Today we look at Barrick Gold and highlight its basing pattern as a reason to have it on your watch list.
Note that the following MarketSurge charts are built with Investors Business Daily’s product suite.
I am an Investors Business Daily (IBD) partner and promote the use of their products. The entire platform offers a good mix of tools, education, and technical and fundamental data.
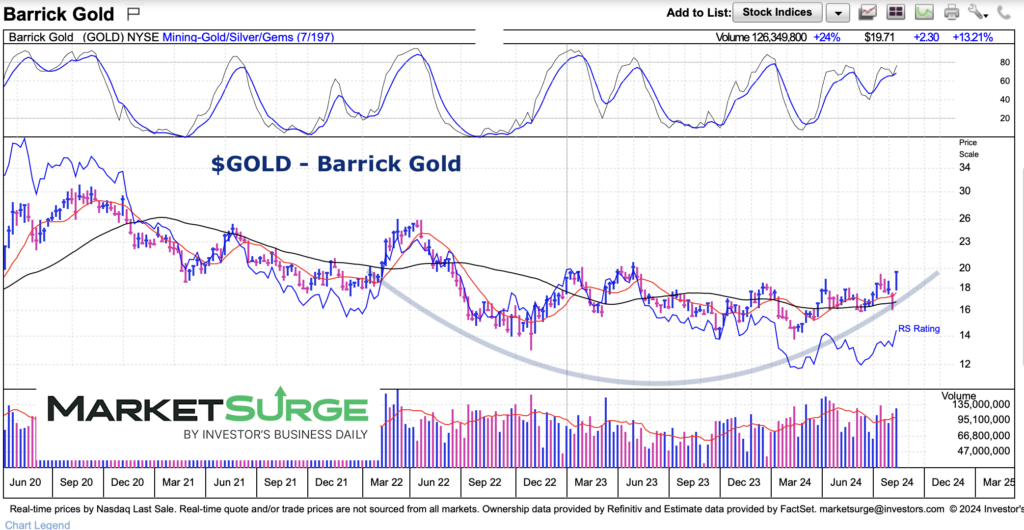
$GOLD Barrick Gold “weekly” Chart
I like charts that speak for themselves. Here we can see the large sideways base that has formed. Note that this is a long-term “weekly” chart so this pattern may take some time before we know if it’s meaningful. A breakout over $21 could very well target $26 (the 2021/22 highs). As the saying goes, the bigger the base, the bigger the breakout.
Twitter: @andrewnyquist
The author may have a position in mentioned securities at the time of publication. Any opinions expressed herein are solely those of the author, and do not in any way represent the views or opinions of any other person or entity.

 and Semiconductors (SMH)")
")

 Make A Higher Low?")
")
 and Semiconductors (SMH)")