Did this past week really resolve which way the Modern Family wants to go from here?
In some ways yes and other ways no.
Yes
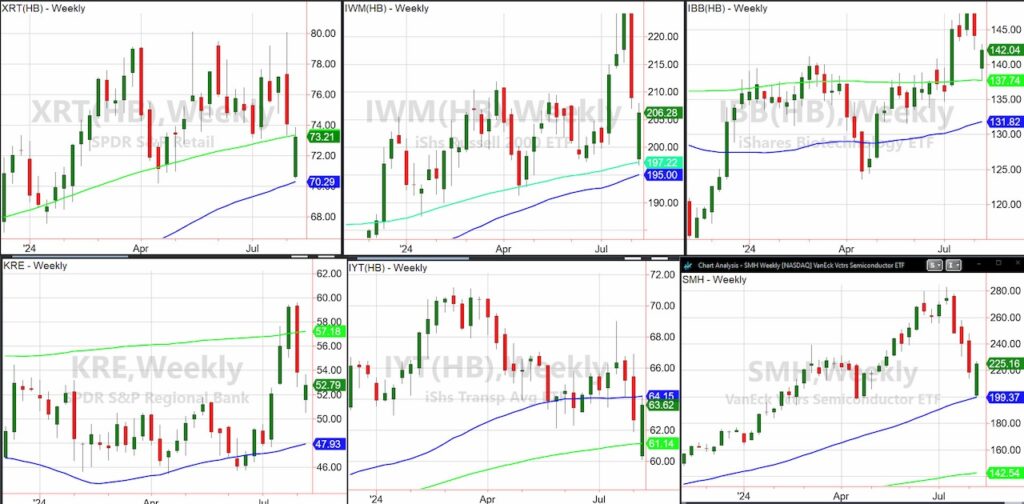
- All are still holding their 50-week moving averages
- Semiconductors remain in a bullish phase with a good bounce off the 50-WMA
- The slopes on all the moving averages both 50 and 200 WMA are pointing up
- Biotechnology IBB corrected perfectly to the 200-WMA and bounced-phase is accumulation-money flow is positive
No
- Granny Retail remains above the 50-WMA but could not clear the 200-WMA-phase is recuperation
- Russell 2000 held the 200-WMA but the bounce looks weak, so IWM has more to prove
- Transportation IYT held the critical support above the 200-WMA, but closed the week questionable on whether it can clear the 50-WMA-phase is caution
- Regional Banks KRE look confused. After a 3-week run higher, they are closing lower for the 2nd week in a row. The phase is recuperation.
That makes the prediction for next week not so easy.
This is why we will call for a lifeline from the Family’s relatives-long bonds and junk bonds to help us.

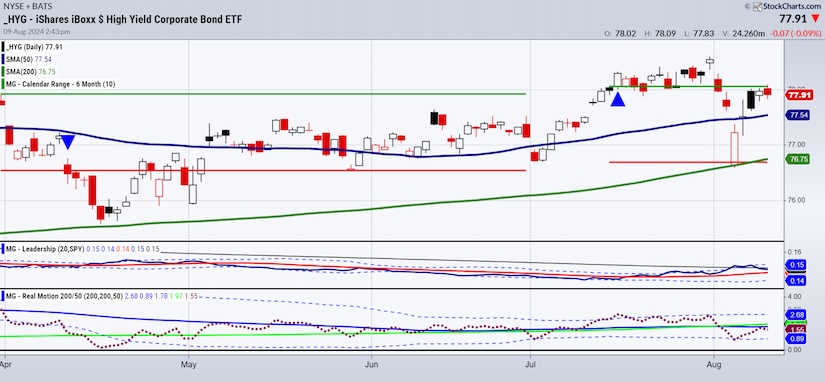
In HYG or high yield junk bonds, the risk remains on. If the Family wants good news from the relatives, this is it.
The July 6-month calendar range high and low is almost identical to the January 6-month calendar ranges.
Fascinating, as we have a yearly support level right where the 200-daily moving average sits.
Right now, besides failing the July range high, HYG does not look too bad.
In fact, we are still at risk on as measured by HYG performance compared to SPY performance.
However, the Real Motion momentum indicator is in a bearish divergence and worsening.
Hence, here is the plan.
If HYG holds here and clears back over 78.00, I would feel a lot better accumulating equities and anticipating the FED keeps the interest rate status quo.
But, if HYG breaks under the 50-DMA at 77.50 get cautious.
And if HYG fails the 200-DMA, get defensive.

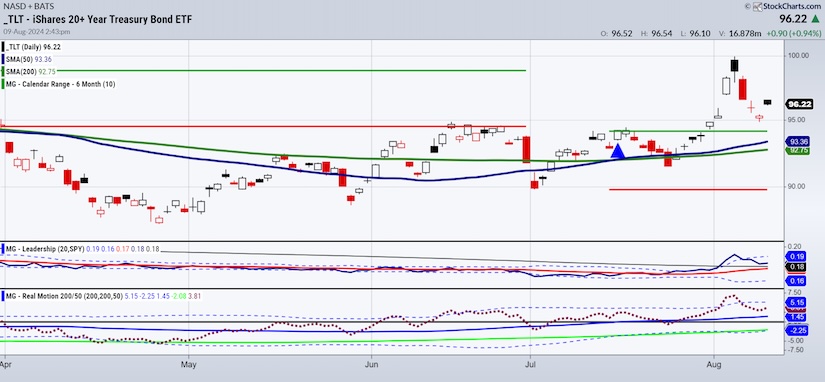
Turning our attention to the long bonds TLT, the evidence leans more to risk off.
First, TLT had a golden cross in July.
Secondly, TLT is above the July 6-month calendar range.
Third, TLT outperforms SPY.
Finally, Real motion shows us that momentum is bouncing.
If the Family is looking for reasons to raise a lot of cash, this is it.
One thing I have learned through the years—
If the market is confused, why should anyone think they shouldn’t be as well?
After all, if I am going to follow anyone’s opinion, it will always only be the opinions that the Family offers. If they are confused, I lighten up.
Twitter: @marketminute
The author may have a position in mentioned securities at the time of publication. Any opinions expressed herein are solely those of the author and do not represent the views or opinions of any other person or entity.


