If there is one thing we have learned through the years, it is that when our all-important family of stock market ETFs trade in the same direction, that is when conditions are best.
Considering the bifurcation of the sectors and (featured last week) that the Long Treasury Bonds ETF (TLT) were already flashing risk off, this week’s unified selling comes as no surprise.
The family of ETFs reacted to Jerome Powell this past week.
Investors heard that interest rate cuts could be coming.
And they took that to mean:
- Fed has lost confidence in the economy
- Higher for Longer should have ended months ago
- The rotation out of tech and into small caps meant nothing more than a technical rather than fundamental correction in an old Granddad.
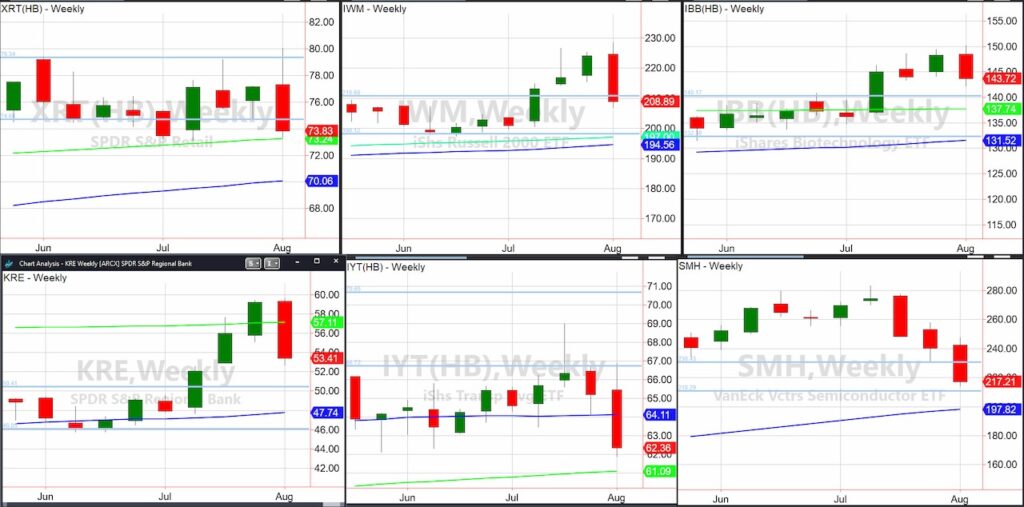
Let’s recap of the weekly charts of these ETFs:
The Retail Sector ETF (XRT) held the 200-WMA (green line) but failed the weekly channel light blue line. That makes it easy-if XRT fails the 200-WMA April lows, we see 70 in focus.
Should XRT rally back over the 200-WMA and some relief, but not much more.
The Russell 2000 ETF (IWM), while failing the top of the weekly channel line, still has lots of underlying support.
Let’s not forget how long it took IWM to clear 210. That is pivotal.
The Biotechnology Sector ETF (IBB) does not look that bad really. IBB has fallen into support and might be the first place to look for a good bounce.
The Semiconductors Sector ETF (SMH) started the sell off rolling 3 weeks ago after peaking at new all-time highs.
Think about how IWM peaked this week, 2 weeks later than SMH. That tells us SMH still reigns over the Family, the economy and the market.
However, tech and chips do not have the legs to support the cracks the economic stats have been suggesting.

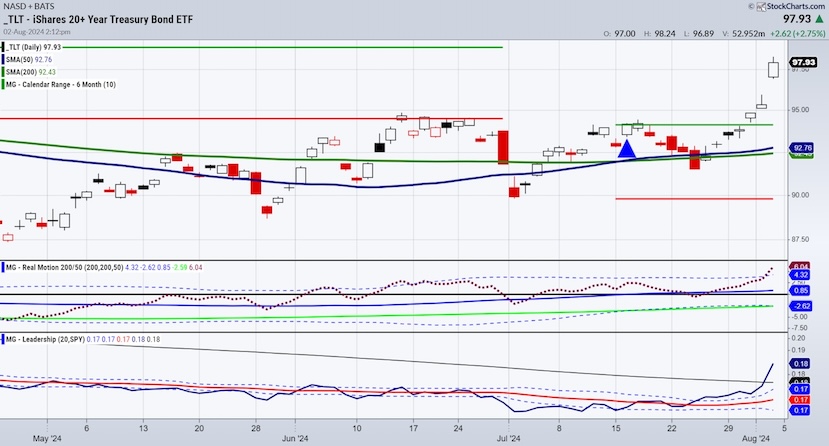
Before we finish the last 2 sectors, let us examine the long bonds TLT.
While we see some resistance at the January 6-month calendar range high (look left to the horizontal green line), the July range was handily taken out.
We were on this setup once Real Motion showed a positive divergence in momentum and the Leadership indicator showed TLT outperforming SPY.
Now, last December’s highs come into view at a price around 100, assuming TLT does not fail to hold above 95.
Moving on to the Transportation Sector ETF (IYT), this sector was the canary in the coalmine.
IYT never participated in the jubilee. Plus, the poor earnings and CrowdStrike debacle did not help.
So, to see IYT below the 50-WMA (dark blue line) again, as it also never cleared back over the weekly channel line low, is well, telling.
How can an economy claim to be robust when the Tran sector performs so poorly?
Finally, the Regional Banks (KRE) are acting all prodigal again.
KRE spent only one week above the 200-WMA. For this coming week, we would like to see the 50-52 level hold. And if so, besides IBB, perhaps the banks will help the market.
Many are claiming this past week as a normal correction wondering why greed became panic in a matter of days.
This feels like more than a correction with the Fed once again behind the curve.
But let us continue to hang with the Family-they always know best!
Twitter: @marketminute
The author may have a position in mentioned securities at the time of publication. Any opinions expressed herein are solely those of the author and do not represent the views or opinions of any other person or entity.


