Typically interest rates fall when the economy is slowing and inflation is dead (often a result of a slowing economy).
Today, we are beginning to see this action. And if it takes hold, the financial markets will likely become more volatile.
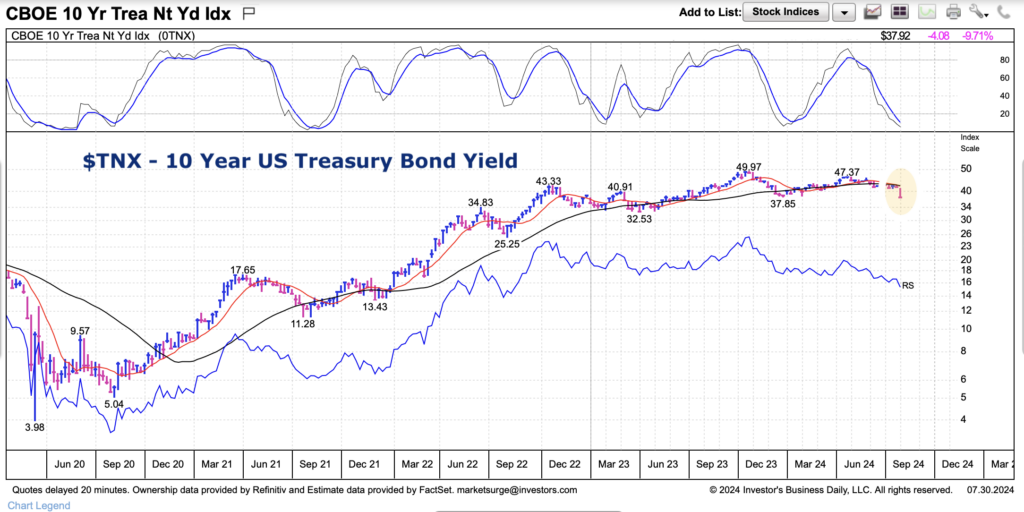
Today’s chart is a weekly chart of the 10-year US Treasury bond yield (TNX). Note that this is the most followed index for determining most consumer loan products – auto loans, mortgages…).
The 10-year bond yield has been in decline for several weeks now. And just this past week saw its yield plummet.
Note that the following MarketSurge charts are built with Investors Business Daily’s product suite.
I am an Investors Business Daily (IBD) partner and promote the use of their products. The entire platform offers a good mix of tools, education, and technical and fundamental data.
$TNX 10-Year US Treasury Bond Yield “weekly” Chart
Here we can see the pullback and most recent weekly “thud” bar. At a minimum, this will inject some confusion and volatility into the markets.

Twitter: @andrewnyquist
The author may have a position in mentioned securities at the time of publication. Any opinions expressed herein are solely those of the author, and do not in any way represent the views or opinions of any other person or entity.


