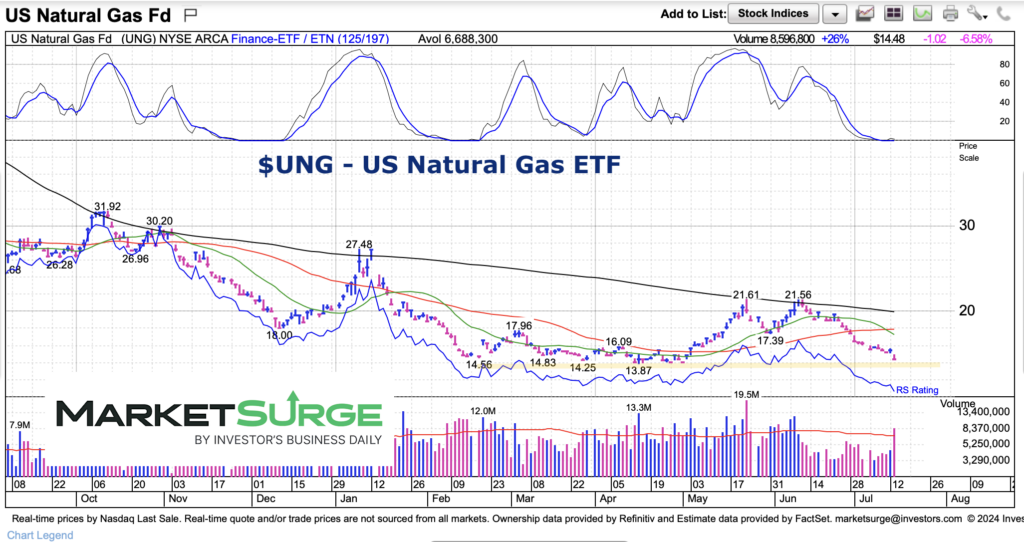
Every time investors and analysts believe natural gas has bottoms… well, it hasn’t. It has been a long grind lower.
BUT, after a 7 month price range basing pattern, it is possible that natural gas is bottoming. Or more specifically, the United States Natural Gas ETF (UNG).
To be fair, the latest price action has been poor and UNG needs to find more buyers soon.
Today we look at UNG and highlight what traders and investors should look for.
Note that the following MarketSurge charts are built with Investors Business Daily’s product suite.
I am an Investors Business Daily (IBD) partner and promote the use of their products. The entire platform offers a good mix of tools, education, and technical and fundamental data.
$UNG U.S. Natural Gas ETF Price Chart
Once again, we share a pretty simple chart of UNG and let it speak for itself. Momentum is cratering as price nears the bottom of the base. Natural Gas bulls need to step up around $13.75 to $14.00.

Twitter: @andrewnyquist
The author may have a position in mentioned securities at the time of publication. Any opinions expressed herein are solely those of the author, and do not in any way represent the views or opinions of any other person or entity.


