Precious metals continue to show strength this year with Gold breaking out to new all-time highs.
Could things get even more bullish for Gold?
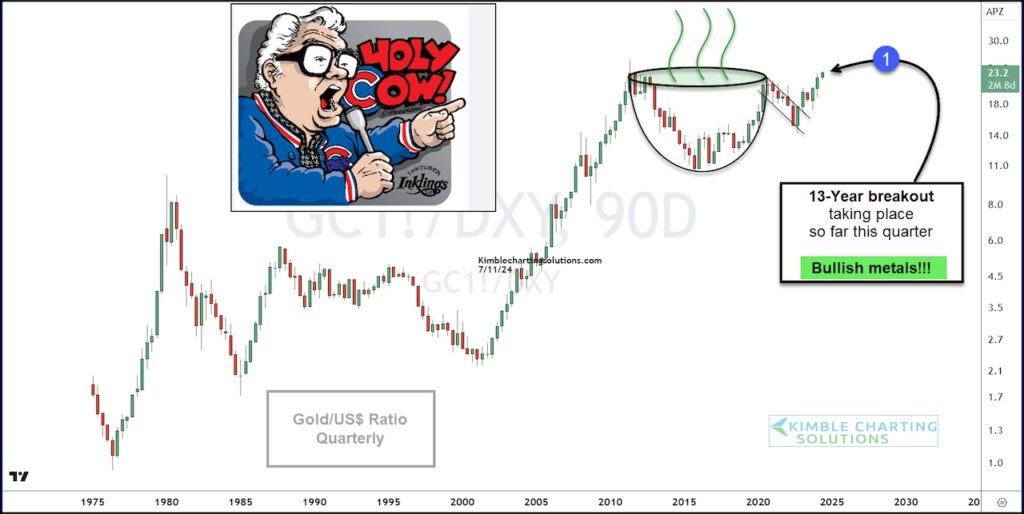
Well, today’s chart highlights a key precious metals ratio that is working on a 13-year breakout.
Below is a long-term chart plotting the price ratio of Gold to the US Dollar. As you can see, this important Gold ratio has formed a bullish cup with handle pattern and price is attempting to breakout at (1).
In my humble opinion, a successful breakout here would be very bullish for gold and precious metals. Stay tuned!
Gold to US Dollar Price Ratio Chart
Note that KimbleCharting is offering a 2 week Free trial to See It Market readers. Just send me an email to services@kimblechartingsolutions.com for details to get set up.
Twitter: @KimbleCharting
The author may have a position in mentioned securities. Any opinions expressed herein are solely those of the author, and do not in any way represent the views or opinions of any other person or entity.


 Pressuring Lower Price Support")


 Pressuring Lower Price Support")