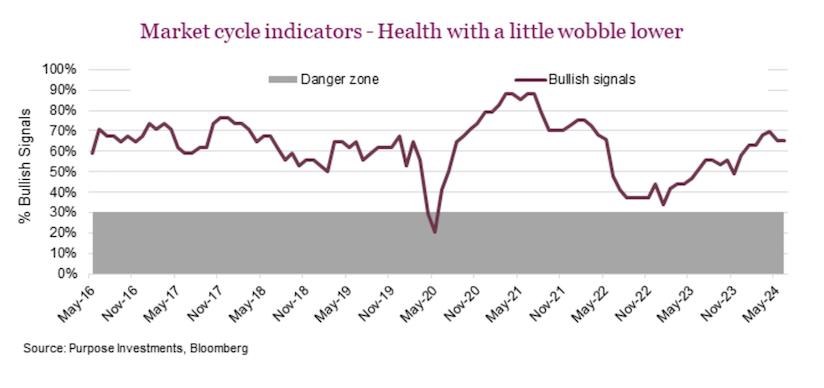
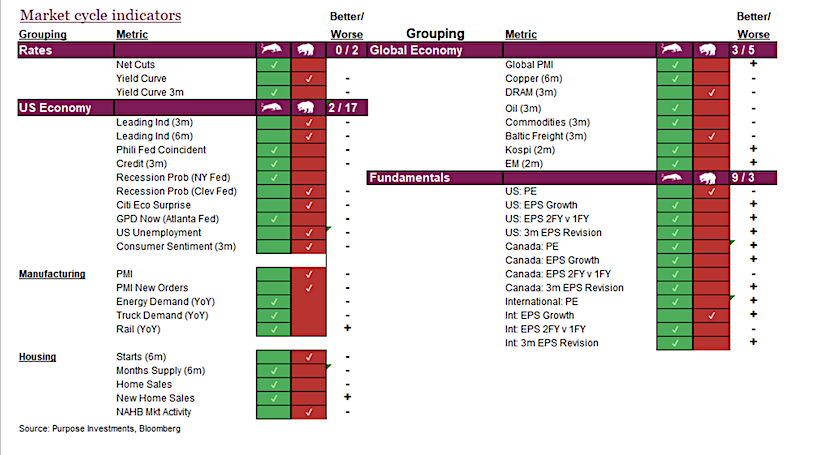
Our market cycle indicators, which total a little over 40, help provide a picture on the health of the market and economy.
No signal or indicator works every time and the goal is to identify if the backdrop is eroding or improving.
This helps differentiate between market weakness that could be a buying opportunity to deploy cash or lean into it, and those that may have worse to come.

The market cycle indicators range from economic data, yields, spreads, commodities, markets and fundamentals. The good news is the number of bullish signals continued to rise in 2023 and this continued into 2024, with a bit of softening in the past few months. This lines up nicely with markets moving higher. The question is whether the recent tick back lower is the start of deterioration or just a little bobble. For now, we are not concerned, Market Cycle remains supportive of markets.
Digging into the specific market cycle indicators there have been a number of changes. While clearly more remain bullish than bearish, the bearish signals have ticked a bit higher. Even more impactful is the trend in the signal strengths for the U.S. economy (softening) and Fundamentals (improving). The ratio of signals improving last month for the U.S. economy was 7 better, 12 worsening. This past month that eroded more to only 2 improving and 17 worsening.
Countering this trend was an uptick in fundamentals, as a lot of the earnings data has improved over the past month. We saw 9 improving with only 3 deteriorating, compared to a month ago, when it was at 4 vs 8. The better economic data year-to-date appears to be making its way into earnings estimates for growth, a positive.

Overall, Market Cycle remains supportive, with a bit of a wobble of late.
No recent changes to our overall portfolio thoughts. We have a mild underweight on equities, very mild after our last few changes. Very mild overweight in bonds and holding a bit extra cash; certainly a bit of a defensive lean. This carries into diversifiers as we are more focused on real assets (gold) and volatility reduction strategies.
Source: Charts are sourced to Bloomberg L.P., Purpose Investments Inc., and Richardson Wealth unless otherwise noted.
The author or his firm may hold positions in mentioned securities. Any opinions expressed herein are solely those of the authors, and do not in any way represent the views or opinions of any other person or entity.


