Investors are constantly looking to gain an edge in the stock market.
One simple way to understand risk in the marketplace is by following Junk Bonds. They are higher risk, so when they do well it is a good sign for the broader market. And when they do poorly, it is a bad sign for the broader market.
Notice I wrote “broader market.” That’s because lately we have seen a couple handfuls of stocks lifting the market higher.
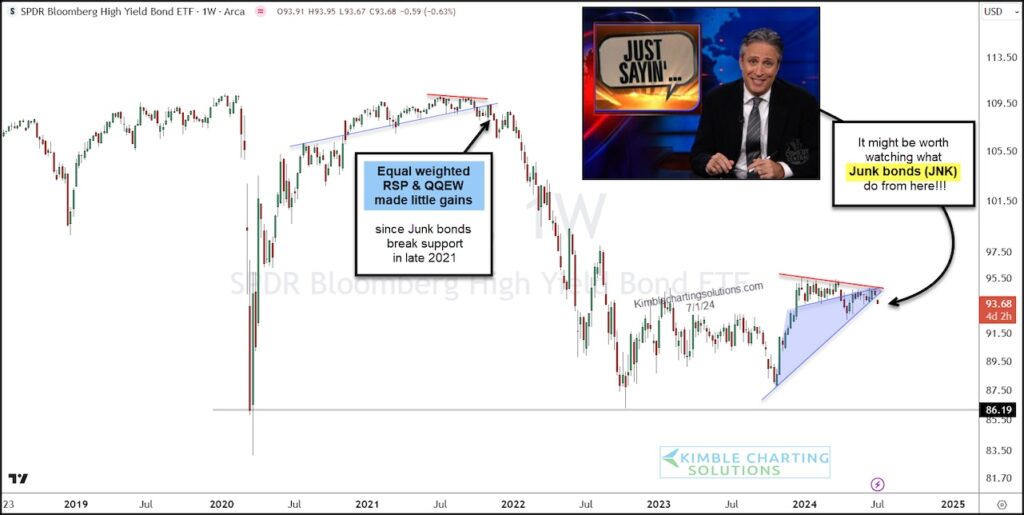
Looking at today’s weekly chart of the Junk Bonds ETF (JNK), we can see that JNK broke below support back in December of 2021 (bearish). And, as we wrote about recently, the equally weighted S&P 500 (RSP) has made little gains in the past 30-months since the JNK breakdown – same goes for the equally weighted Nasdaq 100 (QQEW).
Fast forward to today, and Junk Bonds may be breaking down yet again.
I humbly feel that it might be worth keeping a close eye on them! Will this impact the market’s performance? Stay tuned!
$JNK Junk Bonds ETF “weekly” Chart

Note that KimbleCharting is offering a 2 week Free trial to See It Market readers. Just send me an email to services@kimblechartingsolutions.com for details to get set up.
Twitter: @KimbleCharting
The author may have a position in mentioned securities. Any opinions expressed herein are solely those of the author, and do not in any way represent the views or opinions of any other person or entity.


