Over the weekend as we looked at the entire Economic Modern Family of stock market ETFs, we focused on the Biotechnology Sector ETF (IBB) as particularly intriguing.
We wrote:
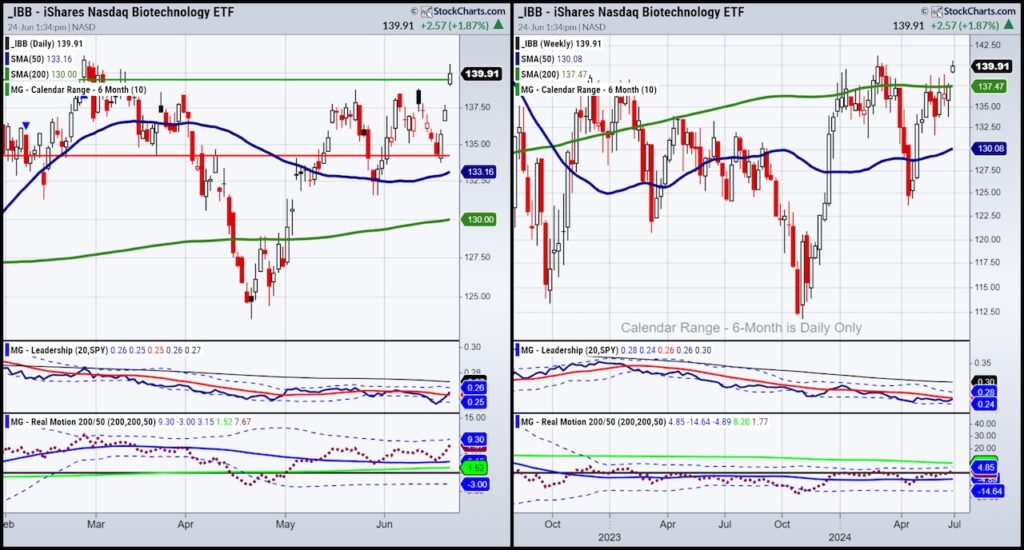
“IBB sits just below the 200-WMA. Plus, he is in the middle of the weekly channel range. Furthermore, back in May, IBB handily cleared above the 50-WMA.
We have eyes here next week as the weekly close was solid and IBB could hit 140or higher.”
Monday, IBB gapped higher.
IBB hit 140.
Now, we give the Biotechnology Sector ETF fresh eyes to see what should happen next so that this is not a one-day wonder.
On the daily chart, IBB cleared the January 6-month calendar range high for the first time since February 2024.
That February high was 141.16.
If IBB can clear that level, it will go to a new multiyear high as this has underperformed the benchmark since late 2021.
The Daily chart also indicates that IBB may begin to outperform SPY.
Plus, momentum is picking up according to Real Motion.
If we move out in timeframe, the weekly chart (the one shown over the weekend) also tells us a story.
The weekly chart shows IBB clearing the 200-WMA (green).
While on this timeframe, IBB is neither outperforming the benchmark nor wowing us with momentum, today’s action is a great first step.
Should IBB hold over 140 as the week and end of the month progresses, we see a potential $20 move up from here.
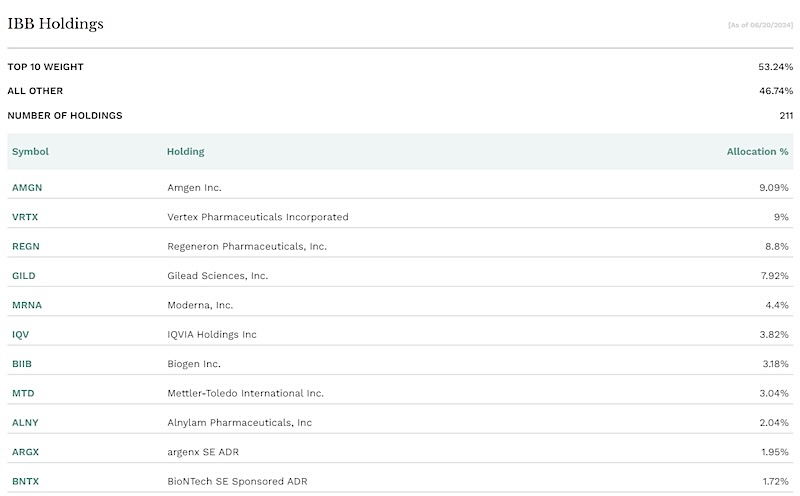
Meanwhile, here are the top 10 stock holdings in the IBB basket:
Twitter: @marketminute
The author may have a position in mentioned securities at the time of publication. Any opinions expressed herein are solely those of the author and do not represent the views or opinions of any other person or entity.

 and Semiconductors (SMH)")
")

 Make A Higher Low?")
")
 and Semiconductors (SMH)")