After a long and steady decline, natural gas prices finally look like they may be bottoming.
Or at least neutralizing the situation.
One factor that might be providing a short-term tailwind to Natural Gas prices is the war in Ukraine. Both Russia and Ukraine are heavy in energy and hard commodities. And Russia provides a significant amount of natural gas to Europe. And it doesn’t seem like anyone is trying for peace.
So let’s look at today’s chart of the U.S. Natural Gas ETF (USO).
Note that the following MarketSurge charts are built with Investors Business Daily’s product suite.
I am an Investors Business Daily (IBD) partner and promote the use of their products. The entire platform offers a good mix of tools, education, and technical and fundamental data.
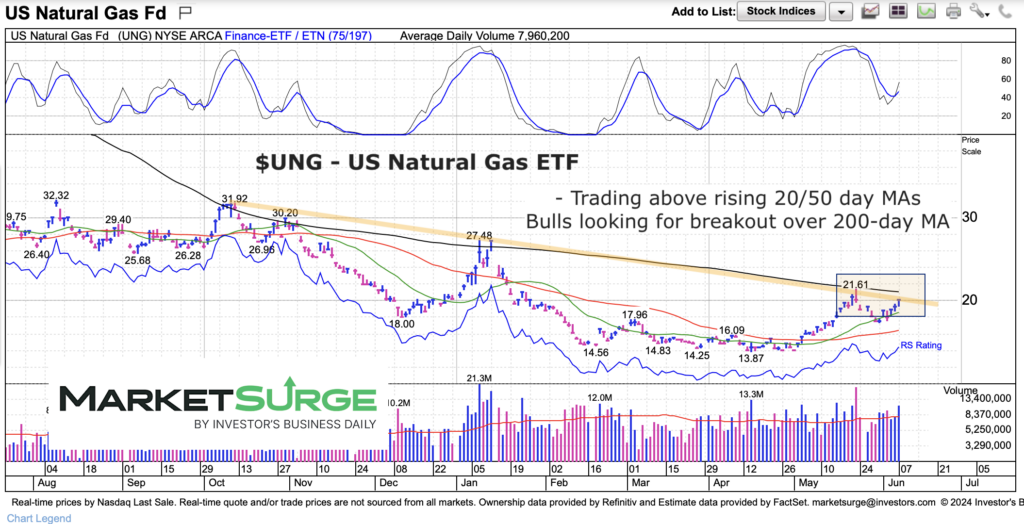
$UNG U.S. Natural Gas Fund ETF Chart
Here we can see that UNG is trading above its now rising 20 & 50 day moving averages. This is a good sign. However, it still needs to clear its 200 day moving average and falling down-trend line. With momentum trying to curl higher, UNG should be watched here.
Overall, there is still work to do as a falling 200-day MA means it will likely take some time to repair the technicals… and restart a new leg higher. Patience.

Twitter: @andrewnyquist
The author may have a position in mentioned securities at the time of publication. Any opinions expressed herein are solely those of the author, and do not in any way represent the views or opinions of any other person or entity.


