US Treasury bond yields have been moving higher for the past 4 years.
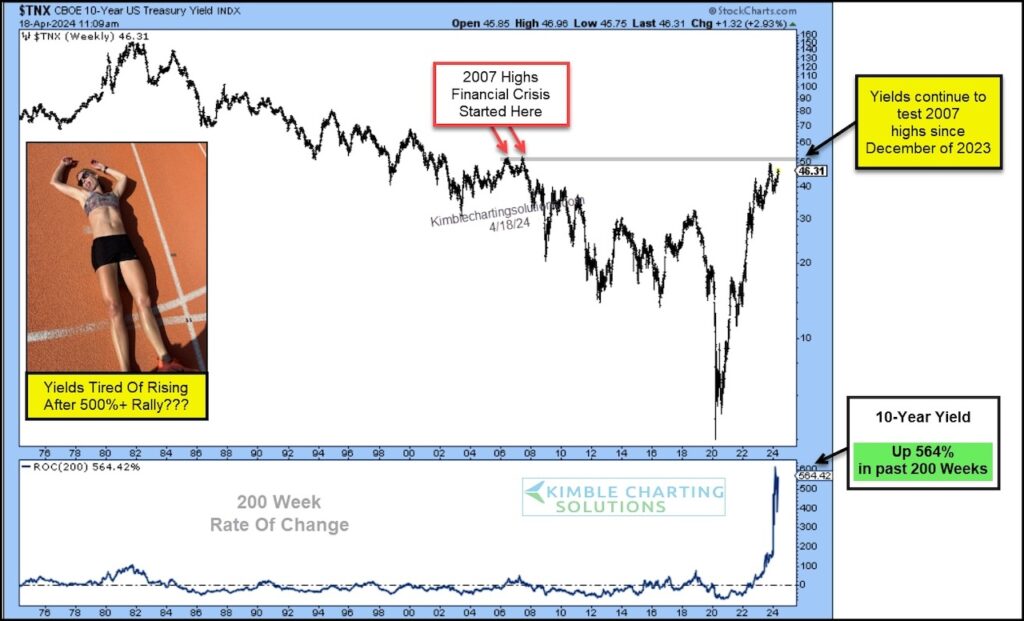
Furthermore, the rally marks the largest 200 week rally in 10-year yield history. Wow!
So today we ask, are yields tired after this big run up? Is it time for a pullback?
Today’s chart highlights the 564% rally over the past 200 weeks. Incredible.
So it seems likely that yields will need some consolidation / pullback soon. And it’s noteworthy that a big test of resistance remains overhead: the 2007 financial crisis highs. Yields would need to breakout over that level for investors to think that yields are headed substantially higher. Stay tuned!
$TNX 10-Year US Treasury Bond Yield Chart

Note that KimbleCharting is offering a 2 week Free trial to See It Market readers. Just send me an email to services@kimblechartingsolutions.com for details to get set up.
Twitter: @KimbleCharting
The author may have a position in mentioned securities. Any opinions expressed herein are solely those of the author, and do not in any way represent the views or opinions of any other person or entity.


