Silver has been quietly building a bullish case for a trading breakout.
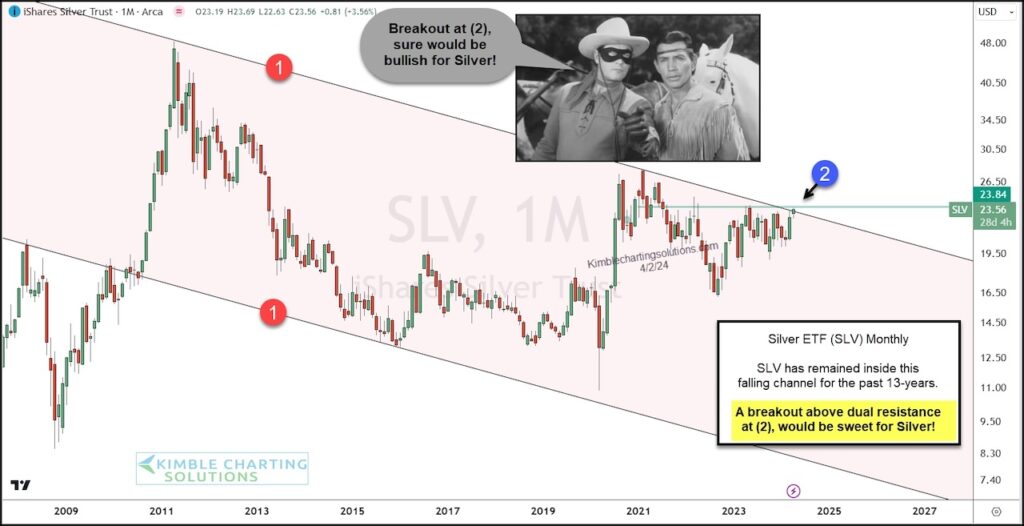
The Silver ETF (SLV) has been coiling just beneath major breakout resistance. And we can see this on today’s long-term “monthly” chart.
Specifically, we can see SLV testing important dual breakout price resistance at (1) and (2). The first represents falling trend line resistance and the second represents more recent lateral resistance.
A breakout here sure would be bullish for Silver! And for Gold!!
To be sure, the entire precious metals complex loves it when Silver is showing relative strength. So this would be HUGE! Stay tuned!!
$SLV Silver ETF “monthly” Price Chart

Note that KimbleCharting is offering a 2 week Free trial to See It Market readers. Just send me an email to services@kimblechartingsolutions.com for details to get set up.
Twitter: @KimbleCharting
The author may have a position in mentioned securities. Any opinions expressed herein are solely those of the author, and do not in any way represent the views or opinions of any other person or entity.


