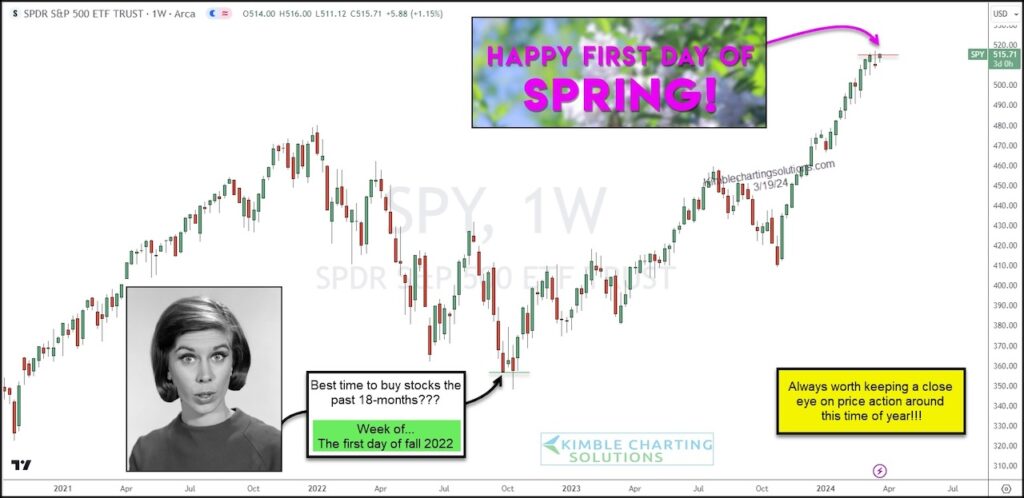
It is always worth keeping a close eye on the stock market price action around this time of year.
18 months ago, it was the first day of fall that seemed to be a great time to buy stocks… and again this last fall. Heck, even spring of 2023 was good. But the broader points is that many turning points (up or down) seem to be magnetized to these seasons.
In today’s “weekly” S&P 500 ETF (SPY) chart, we can see this. But more notable is what has been happening since the stock market bottomed last fall. In basic terms, SPY has gone straight up in a very strong bull market rally. But the seasonal Spring equinox is upon us.
In the past 3 weeks, the S&P 500 has consolidated as it awaits the outcome of the March 20 Federal Reserve meeting… and into the first day of spring!
It’s that time of year. Will we get a breakout or a turn lower? Stay tuned!
S&P 500 ETF (SPY) “weekly” Chart

Note that KimbleCharting is offering a 2 week Free trial to See It Market readers. Just send me an email to services@kimblechartingsolutions.com for details to get set up.
Twitter: @KimbleCharting
The author may have a position in mentioned securities. Any opinions expressed herein are solely those of the author, and do not in any way represent the views or opinions of any other person or entity.


