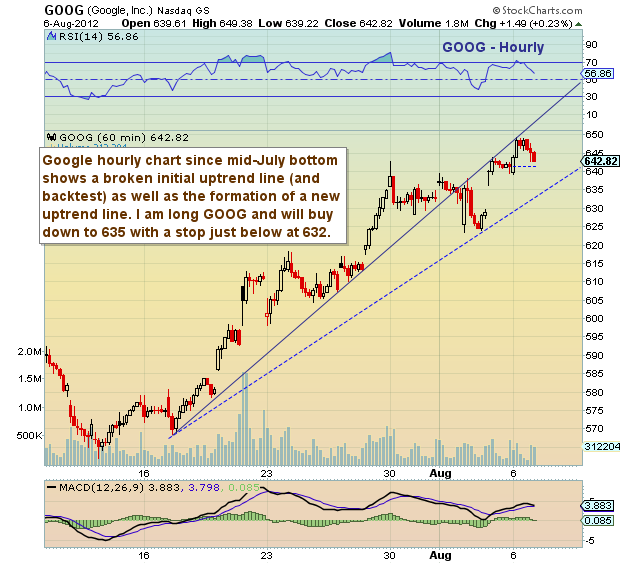
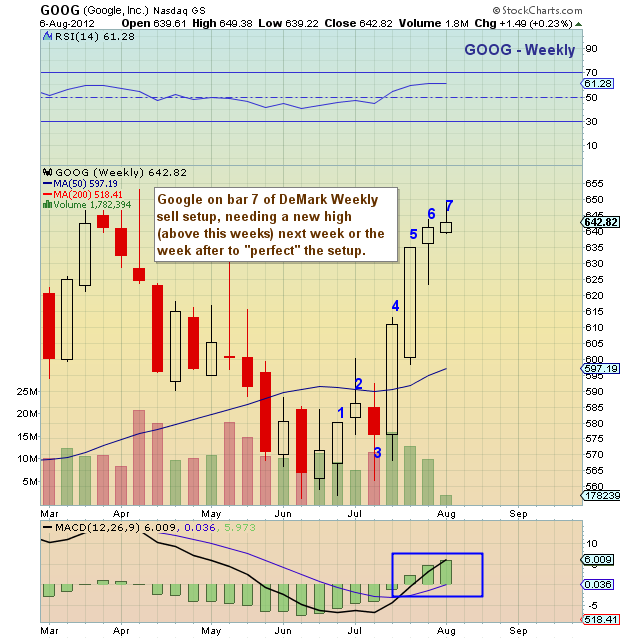
 Yesterday I was scanning charts from the outside in (long term to short term) when I came across Google’s (GOOG) weekly chart setup.
In short, the chart indicated that GOOG was on bar 7 of a weekly DeMark sell setup 9. Now there’s no guarantee that this will run to completion, but if it does, the stock will likely go higher and need a new high (above this week’s high) next week or the following week.
But that wasn’t all that caught my attention. I also saw a pretty clear risk-reward with looking at an hourly chart from the July lows. So I took a position in Google into the yesterday’s close on weakness and plan to add down to 635, with a stop below around 632. Update: I bought another tier on Tuesday morning / Final Update: I sold a tier on Wednesday strength and tightened stop.

Trade safe, and always define your risk.
Google stock charts with price support and resistance levels. GOOG stock charts with technical analysis as of August 6, 2012. GOOG trade setup idea.
———————————————————
Twitter: @andrewnyquist and @seeitmarket Facebook: See It Market
Author has a position in GOOG at the time of publication.
Any opinions expressed herein are solely those of the author, and do not in any way represent the views or opinions of his employer or any other person or entity.


