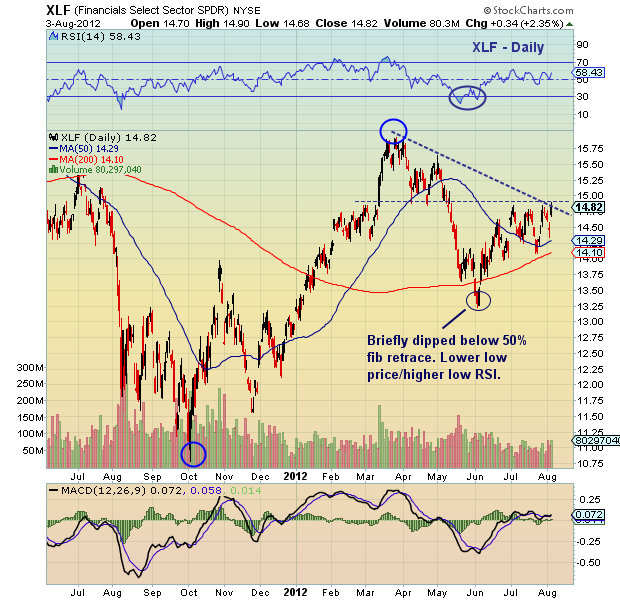
 Similar to the Bank Index (BKX), the Financials Select Sector (XLF) is on the verge of breaking out. So if the finnies aren’t already on your radar, add them to it. See BKX chartology here.
No doubt, the financials will be important to watch in the week ahead. Not there yet, so stay patient or keep tight stops until confirmed. But a sustained break higher would go a long way in confirming the current market rally. As Todd Harrison of Minyanville so aptly says, “as goes the Piggies, so goes the poke.”
As well, keep your eye on the European markets and any additional action to assist their banks. And as always, trade safe.
Financials Select Sector (XLF) technical chart with support and resistance levels. XLF financials technical analysis with fibonacci retracement levels. The XLF is representative of financials sector. Is the XLF ready to break higher.
Twitter: @andrewnyquist and @seeitmarket Facebook: See It Market
No position in any of the securities mentioned at the time of publication.
Any opinions expressed herein are solely those of the author, and do not in any way represent the views or opinions of his employer or any other person or entity.


