One thing the market has mostly lacked for the past 2-plus years is small cap stock leadership.
This usually comes by way of small cap stocks and the Russell 2000 outperforming the broader indexes. Let’s just say that these moments have been few and far between.
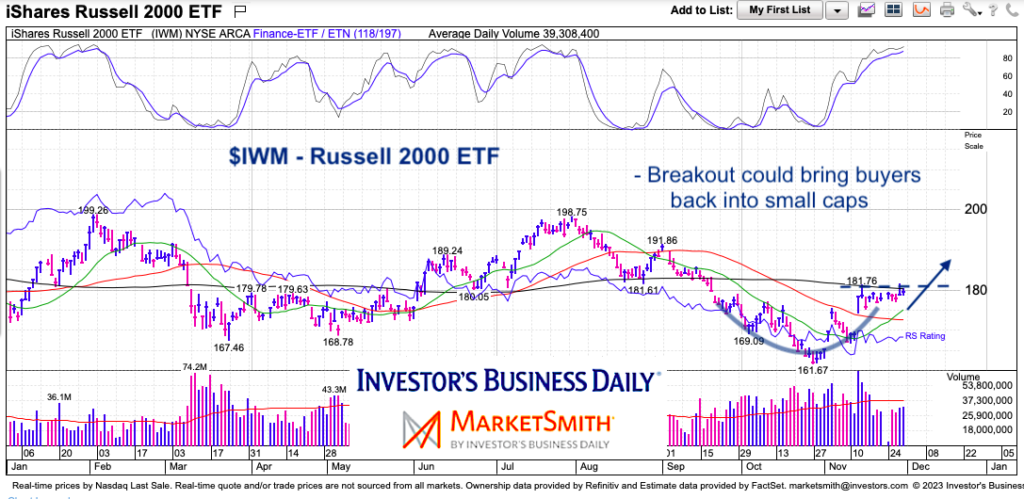
And while I won’t try to make a case that small cap stocks are outperforming much of anything right now, I will say that the Russell 2000’s performance is improving and the index could be setting up for higher prices.
Today we look at the recent trading price pattern on the Russell 2000 ETF (IWM) and what to watch for. Risk-on stock bulls should be watching this and rooting for IWM.
Note that the following MarketSmith charts are built with Investors Business Daily’s product suite.
I am an Investors Business Daily (IBD) partner and promote the use of their products. The entire platform offers a good mix of tools, education, and technical and fundamental data.
$IWM Russell 2000 ETF Chart
Here we see a rounded bottom pattern (base) followed by a brief lift and consolidation at critically important price resistance. A move over the recent highs and 200-day moving average would open the door for better things for IWM.

Twitter: @andrewnyquist
The author may have a position in mentioned securities at the time of publication. Any opinions expressed herein are solely those of the author, and do not in any way represent the views or opinions of any other person or entity.


