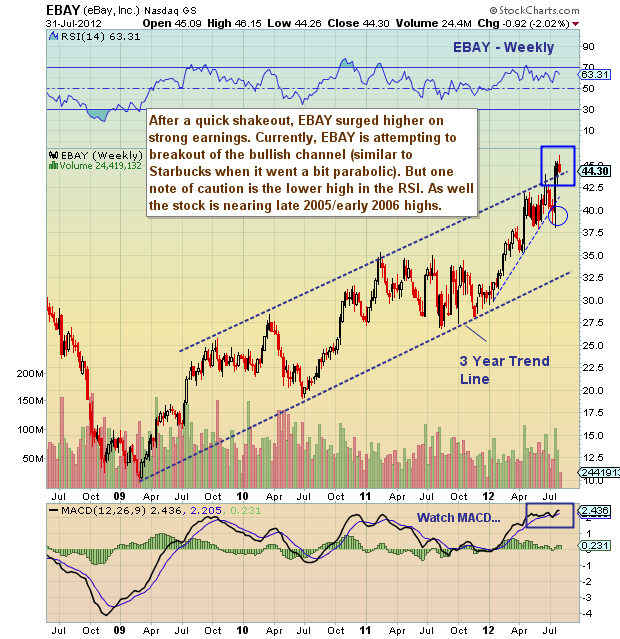
 After a quick post earnings report surge higher, eBay, Inc (EBAY) stock finds itself in an interesting position: a bit extended and sitting above the top of its bullish channel. No doubt, a left to right scan finds the stock pattern to be bullish, but it is well above its long term trend line and nearing 2006 highs at 47.
eBay, Inc EBAY stock chart with technical analysis overlay as of July 31, 2012. EBAY stock technical support and resistance levels with trend lines and defined bullish channel. EBAY technical stock chart with long term support trend line.
———————————————————
Twitter: @andrewnyquist and @seeitmarket Facebook: See It Market
No position in any of the securities mentioned at the time of publication.
Any opinions expressed herein are solely those of the author, and do not in any way represent the views or opinions of his employer or any other person or entity.


