Today’s technology stocks make the world run. The tech sector and select large cap stocks have lead the broader bull market for nearly 14 years.
So when they are weak, investors should take note!
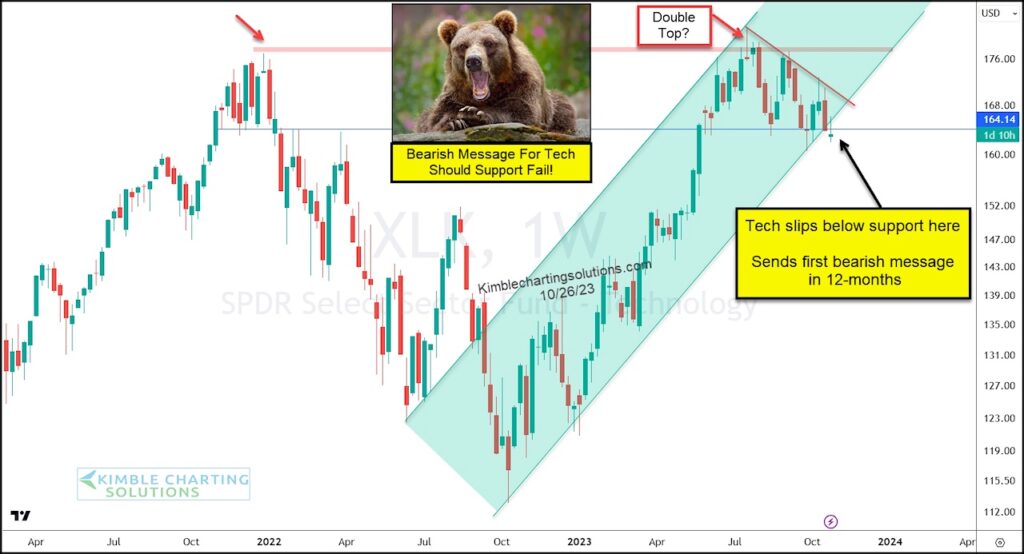
Today’s chart takes a “weekly” view of the S&P Technology Sector ETF (XLK).
As you can see, price hit resistance at last years highs potentially forming a double top. And now it appears that XLK is testing a very important lateral price support level.
In fact, it has slightly breached that level and needs to rally back to retake it soon.
Should it break, this increases the odds that a double top is in play… with a deeper decline. Stay tuned!
$XLK S&P Technology Sector ETF “weekly” Chart

Note that KimbleCharting is offering a 2 week Free trial to See It Market readers. Just send me an email to services@kimblechartingsolutions.com for details to get set up.
Twitter: @KimbleCharting
Any opinions expressed herein are solely those of the author, and do not in any way represent the views or opinions of any other person or entity.


