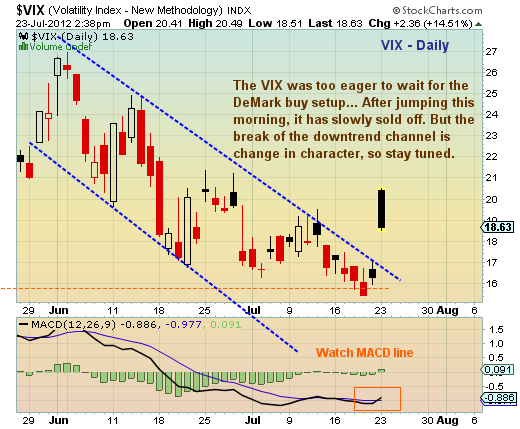
 The Volatility Index (VIX) popped this morning as fear out of Europe (Spain) crept into the market place. But as the day wore on, the VIX steadily sold off all day. In last week’s S&P 500 Weekend Update, I posted a chart of the VIX indicating that today would be bar 7 of a DeMark buy setup 9. No dice there, as the index leaped higher cancelling the setup.
It is notable, however, that the index did break the downtrend channel which is a change in character.
Volatility Index (VIX) daily chart with support and resistance and technical analysis as of July 23, 2012. VIX channel. Volatility Index ticker is VIX.
———————————————————
Twitter: @andrewnyquist and @seeitmarket Facebook: See It Market
No position in any of the securities mentioned at the time of publication.
Any opinions expressed herein are solely those of the author, and do not in any way represent the views or opinions of his employer or any other person or entity.


