 From the emergence and competition of natural gas to slowing global demand to the recent Patriot Coal (PCX) bankruptcy filing, the coal industry has been taken down and beaten up real good. Many coal names are down anywhere from 60 to 80 percent from their 2011 highs and many investors are now wondering if these companies have the financial balance sheets to survive the down turn.
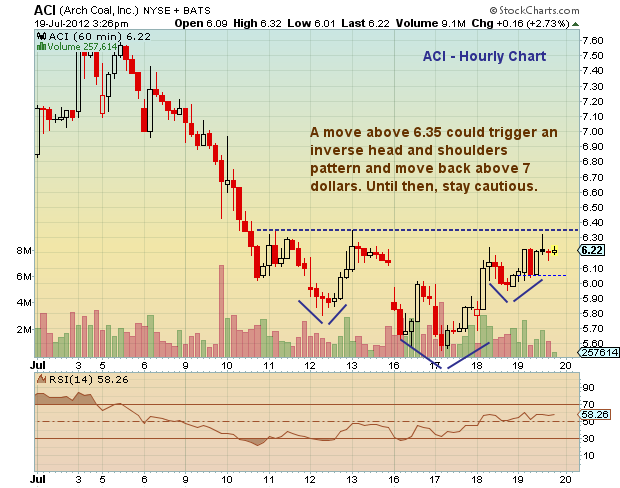
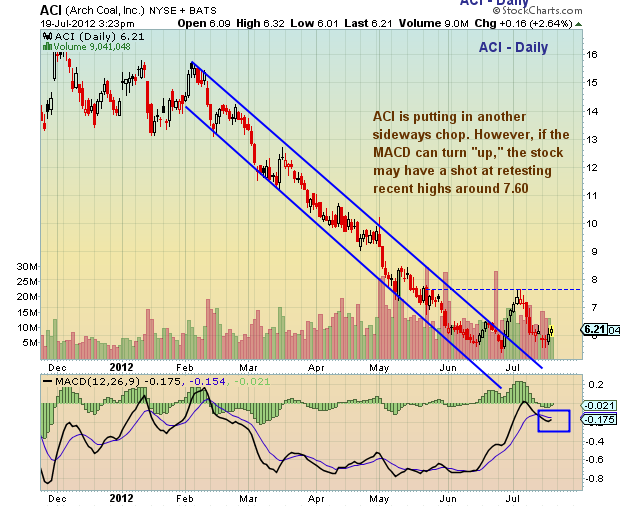
One such coal company is Arch Coal (ACI); it has seen its share price drop over 80 percent from its 2011 highs. Anyone interested in Arch Coal (or any other coal names for that matter) first and foremost have to realize that they are high risk. As well, traders need to get in tune with the technical backdrop and create a risk defined trading plan before entering. Below are hourly, daily, and weekly charts for coal investors/watchers. Warning, not pretty.
Note that I have a position in Arch Coal for a short term trade (“adjustable” trailing stop, 5.92). I’ll add on trade over 6.35 for target of 6.90-7.00. Or take my loss and live to trade another day.
Arch Coal (ACI) stock charts as of July 19, 2012. Arch Coal technical Analysis with support and resistance levels on hourly, daily, and weekly stock charts. Arch Coal stock ticker is ACI.
———————————————————
Twitter: @andrewnyquist and @seeitmarket Facebook: See It Market
Position in Arch Coal (ACI) at the time of publication.
Any opinions expressed herein are solely those of the author, and do not in any way represent the views or opinions of his employer or any other person or entity.


