With bond yields (and interest rates) rising sharply, it’s understandable that most of the world is hoping for lower rates.
Lower interest rates allow for more flexible lending to both businesses and consumers… BUT…
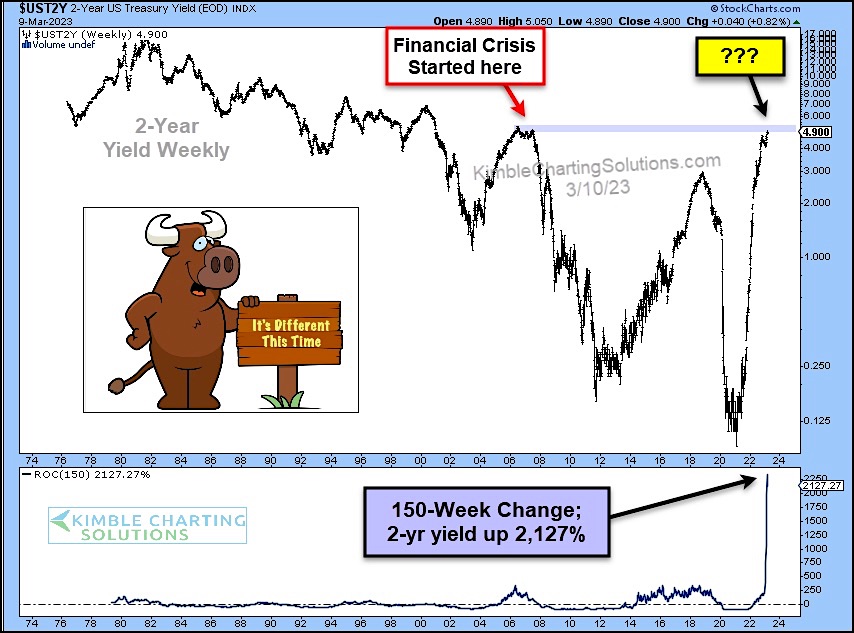
As the “weekly” chart below shows, the last time 2-Year bond yields were this high and interest rates turned lower, it was the start of challenges for stocks (i.e. The Financial Crisis).
And currently, 2-Year treasury bond yields are testing that very same level! And the 150-week change is up 2,127% Yikes!
Will they turn lower here? Will it be different this time? Stay tuned!
2-Year US Treasury Yield “weekly” Chart

Note that KimbleCharting is offering a 2 week Free trial to See It Market readers. Just send me an email to services@kimblechartingsolutions.com for details to get set up.
Twitter: @KimbleCharting
Any opinions expressed herein are solely those of the author, and do not in any way represent the views or opinions of any other person or entity.


