Interest rates are rising. Yes they are in an up-trend.
And the only thing that seems likely to stop them from rising is a recession.
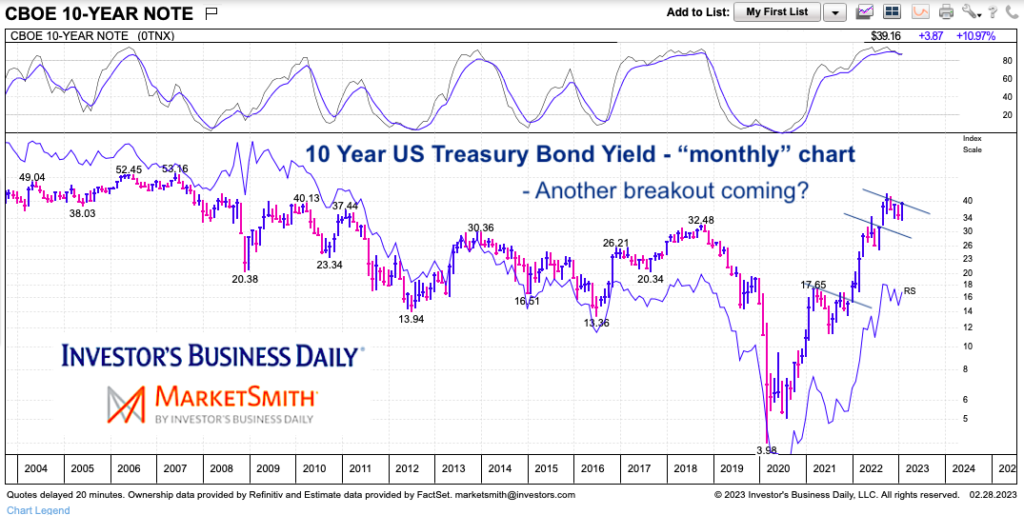
BUT the US economy and consumer have been resilient in the face of rising interest rates. Looking at today’s chart, however, I’m not sure how much longer this will last. Today we look at a long-term chart of the 10-Year US treasury bond yield while highlighting the severity of the reversal higher and its pattern of breakouts.
Note that the following MarketSmith charts are built with Investors Business Daily’s product suite.
I am an Investors Business Daily (IBD) partner and promote the use of their products. The entire platform offers a good mix of tools, education, and technical and fundamental data.
10-Year US Treasury Bond Yield “monthly” Chart
The chart speaks for itself. The reversal higher was fast and furious and should concern most market participants and consumers. And it doesn’t look like bond yields (interest rates) are done rising.
There is a clear pattern of interest rates pausing for a few months before breaking out higher. This very well may be the case again right now. The Federal Reserve doesn’t appear ready to hit the breaks on interest rate hikes. So higher we go… until the economy cracks.

Twitter: @andrewnyquist
The author may have a position in mentioned securities at the time of publication. Any opinions expressed herein are solely those of the author, and do not in any way represent the views or opinions of any other person or entity.


