Utilities stocks have been in a long-term uptrend over the last 20 years.
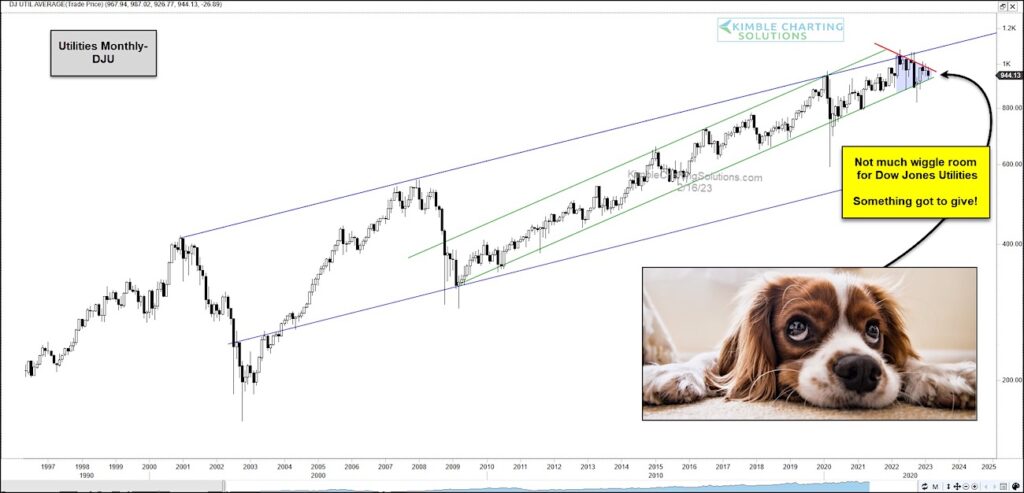
This tremendous trend can be seen in the “monthly” chart of the Dow Jones Utilities Index below.
Note, however, that the rising trend channel is quite wide. And within this wide trend channel there is a narrower 14-year rising trend channel that has formed. This is creating a tightening pattern with resistance overhead and rising support just below (see arrow).
To put it bluntly, there is not much wiggle room for the Utes! Something has to give!
In my humble opinion, should the Utilities Index break below this narrowing 14-year rising support, it would send a bearish message to stocks.
There’s a lot of room to the downside to the bottom of the 20-year channel. Yikes! Stay tuned!
Dow Jones Utilities Index “monthly” Chart

Note that KimbleCharting is offering a 2 week Free trial to See It Market readers. Just send me an email to services@kimblechartingsolutions.com for details to get set up.
Twitter: @KimbleCharting
Any opinions expressed herein are solely those of the author, and do not in any way represent the views or opinions of any other person or entity.


