 By Alex Salomon
As I have written before in “Investment Lessons for Life,” I strive to limit my number of transactions (and urge to trade all the time) by timing my investments (long and shorts) based on a multitude of indicators. In short, I try to pick my spots and define my risk with stops based on my risk profile.
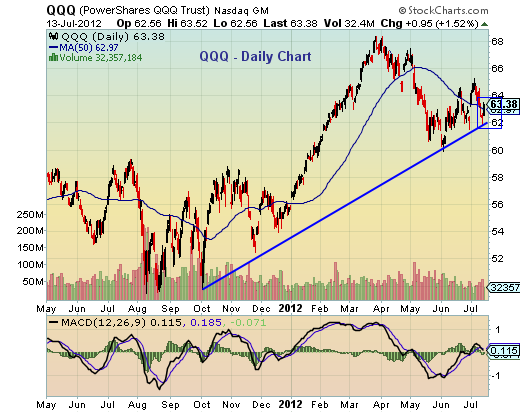
Based on the indicators I follow, the current structure of the market is very tenuously bullish and it creates an interesting spot and time to pick a few entry points on stocks. The reason I would invest this week is exactly because I know the floors I am looking at and understand that they define my risk. So it is with this in mind that I would only use bullish swing trades if (1) S&P 500 stays above 1330 and (2) if the Nasdaq 100 stays above its 30-week moving average around $63.
I am looking at many other signals and charts, but these 2 elements assist in defining risk for my trading book. And, if broken to the downside, would offer bearish / short entry positions. But, for now bullish support.
The first 2 obvious trading ideas are therefore bullish positions on the SPDR S&P 500 ETF (SPY) and Powershares QQQ ETF (QQQ), or, depending on one’s risk profile, short-term trading and holding of the leveraged ETFs tracking SPY and QQQ.
A better entry to SPY was Friday morning but the uptrend remains protected. Likewise, QQQ offers a decent risk-reward around the Friday 07/13 closing price (63.38), with risk defined by the 07/12 and 07/13 lows. Upside can be found at $64. And further, a decisive break of $64.30 could re-open a move to $66 – $68.
As an example, my trading plan for QQQ looks like this: Entry on Monday, risk defined by a stop at $62.50, first profits at $64.30 OR add at $64.30 and therefore, increase your stop back to original entry point; then take profits at $65.50 (your trailing stop should now be above your entry point), take more profits at $67.50 and use $1.00 as your trailing stop should we burst higher
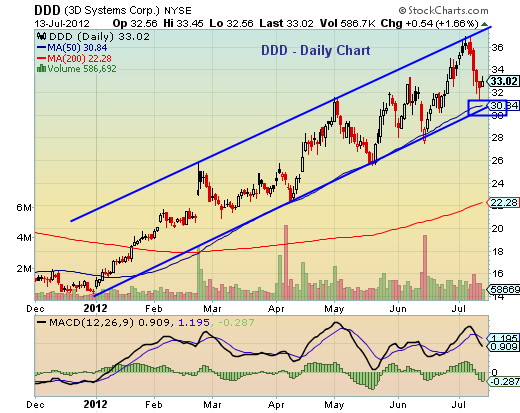
Analysis and my trading plan: Extremely defined uptrend channel with 50 day SMA (simple moving average) offering staunch support (clearly defines current risk)… Buy right now on a bounce off that SMA-30 support and use the maximum weakness of 50 day SMA = 7% trailing stop or lower channel support. Take first profit at 7% up (roughly $35.25) and set stop at break even. Take profits again at $37.50, increasing trailing stop to 15% and let it ride.
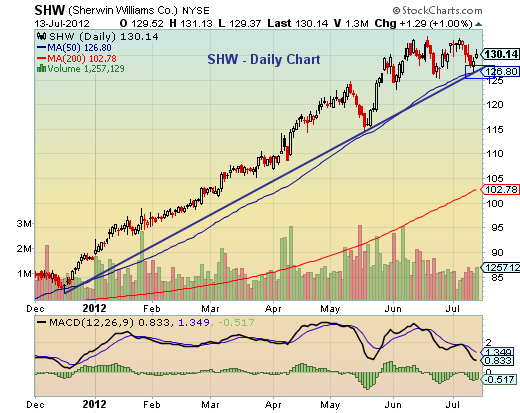
It is currently resting near support and the Stochtastics are turning, which could mean that the recent “relative” weakness was a sign of accumulation and correction over time (not price). And thus portending to a move higher.
On a tight short-term scale and tight risk profile, I will use 07/12 $127 as my risk and look to book profits at $133, $136 and trail the rest $3 for as long as possible. On a longer term risk profile, I would use June 1 “remember the gloom and doom” of $124 as my risk and thus book profits at $136, $142 and trail the rest as long as possible — using a longer trail (for instance, if the stock hit $142, I would use a $130 trail).
Lastly, I am bound to consider iShares Semiconductor Sector (SOXX) again, as it is revisiting support from the previous break out and a repeat performance could yield $50 to $52. Intel Corporation (INTC) is equally compelling right here, reporting on 07/17 and only expected to grow 5% from last year’s quarter. That number could lead to an upside surprise, so INTC will be my large cap earnings play of the week.
Good luck and remember to always trade safe (with stops and a plan!).
—————————————————————-
Twitter: @alex__salomon @seeitmarket Facebook: See It Market
Any opinions expressed herein are solely those of the author and do not in any way represent the views or opinions of his employer or any other person or entity.
No position in any of the securities mentioned at the time of publication.


