It’s been a wild ride for the real estate sector and investors.
After the covid crash, the stock market perked up and investors grabbed real estate while interest rates were extremely low.
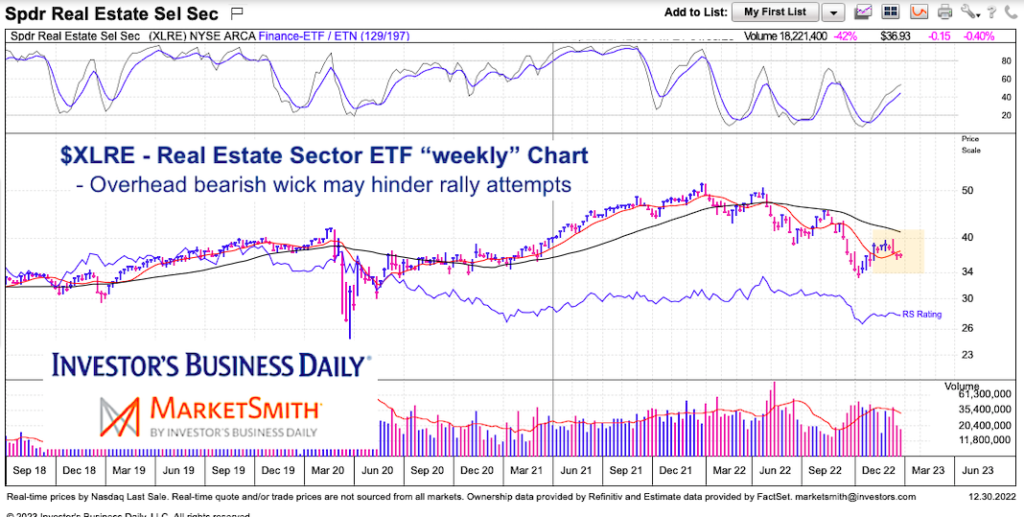
But as energy prices rose, so did housing prices. But home buyers didn’t care, they continued to buy until interest rates began rocketing higher to keep up with inflation. And now elevated rates have real estate on the ropes. And this can be seen in today’s intermediate-term chart of the Real Estate Sector (XLRE).
Note that the following MarketSmith charts are built with Investors Business Daily’s product suite.
I am an Investors Business Daily (IBD) partner and promote the use of their products. The entire platform offers a good mix of tools, education, and technical and fundamental data.
$XLRE Real Estate Sector ETF “weekly” Chart
As you can see, the past 4 weeks (or month of December) hasn’t been kind to the Real Estate Sector (XLRE). And 3 weeks ago, the sector reversed really hard and produced a bearish wick.
This week’s close puts XLRE over 25% off its high. And, until we see a meaningful base develop, the trading trend remains bearish. And as long as this is the case, one cannot be bullish on the economy. Looks like fits and starts for the coming weeks…

Twitter: @andrewnyquist
The author may have a position in mentioned securities at the time of publication. Any opinions expressed herein are solely those of the author, and do not in any way represent the views or opinions of any other person or entity.


