The strength in the U.S. Dollar currency along with treasury bond yields (interest rates) has been relentless all year. And this has pressured stocks and added volatility to the markets.
With both King Dollar and interest rates easing, could this be bullish stocks and commodities (oil, gold, etc.)?
Let’s check in with Joe Friday for “The facts, Ma’am. Just the facts.”
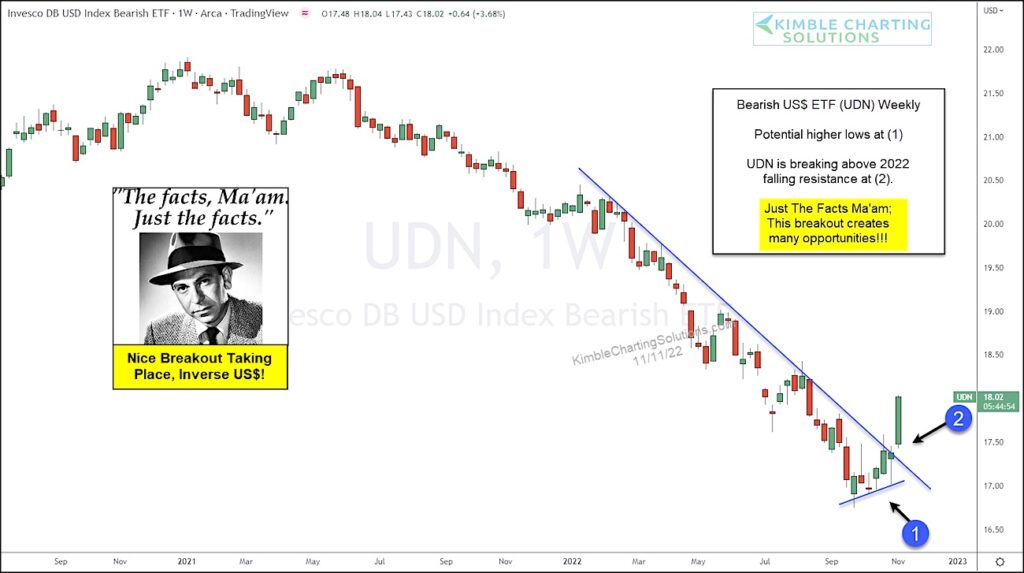
Today’s chart illustrates the price movement of the inverse US Dollar. More specifically, it is the Bearish US Dollar ETF $UDN on a “weekly” basis. As you can see, a weaker dollar has this bearish dollar etf flying higher.
$UDN created higher lows and a wedge pattern at (1) before breaking out big-time at (2).
This breakout should create many opportunities across the equities, bonds and commodities spaces. And perhaps take a little stress out the markets. We’ll see. Stay tuned!
Bearish US Dollar ETF (UDN) “weekly” Chart

Note that KimbleCharting is offering a 2 week Free trial to See It Market readers. Just send me an email to services@kimblechartingsolutions.com for details to get set up.
Twitter: @KimbleCharting
Any opinions expressed herein are solely those of the author, and do not in any way represent the views or opinions of any other person or entity.


