The 2022 bear market has seen the technology sector lead the market lower.
This is apparent when looking at the performance ratio of the Nasdaq Composite to S&P 500 Index.
Tech is extremely important to the broader stock market and has been a market leader over the past decade plus.
But as October comes to a close and the masses welcome Halloween, we look within the technology arena and focus on a key technology leader: The Semiconductors (SMH).
Tech bulls and bears are asking, Trick or Treat?
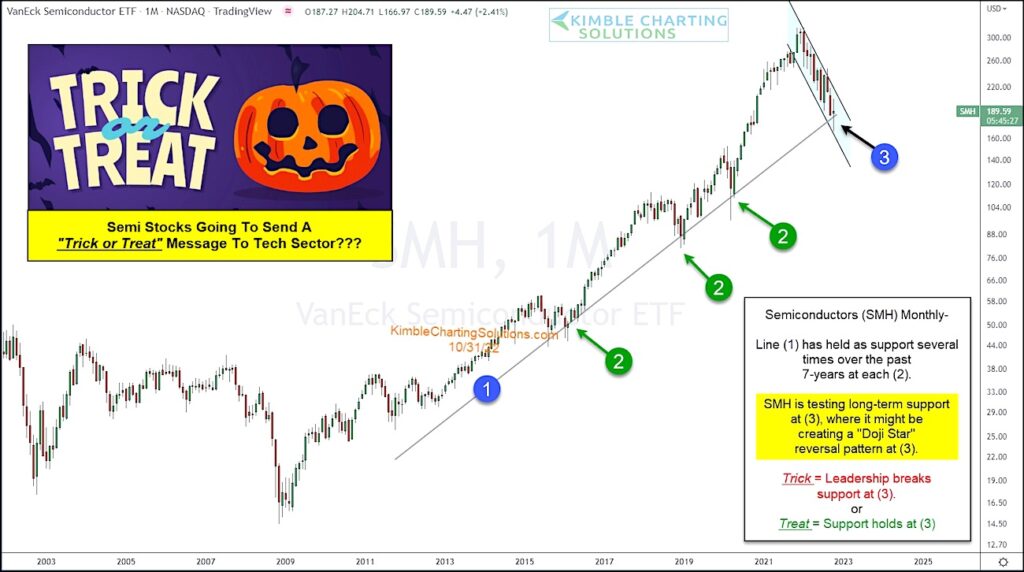
Below is a long-term “monthly” chart of the Semiconductors Sector $SMH. A very clear rising trend-line has formed as marked by (1). This trend line has been tested several times at each (2) and held.
SMH is currently testing long-term support at (3) where it may be creating a “Doji Star” reversal pattern.
Trick (bearish) = tech leadership breaks price support at (3).
Treat (bullish) = tech leadership holds price support at (3).
It’s October 31st and the close for the end of the month seems quite important! Stay tuned!
$SMH Semiconductor Sector ETF “monthly” Chart

Note that KimbleCharting is offering a 2 week Free trial to See It Market readers. Just send me an email to services@kimblechartingsolutions.com for details to get set up.
Twitter: @KimbleCharting
Any opinions expressed herein are solely those of the author, and do not in any way represent the views or opinions of any other person or entity.


