If the stock market is going to embark on a durable rally, bulls will need to see “risk on” assets begin to climb.
There are several of these type of assets/indicators, including small cap stocks, growth stocks, crypto-currency, and junk bonds.
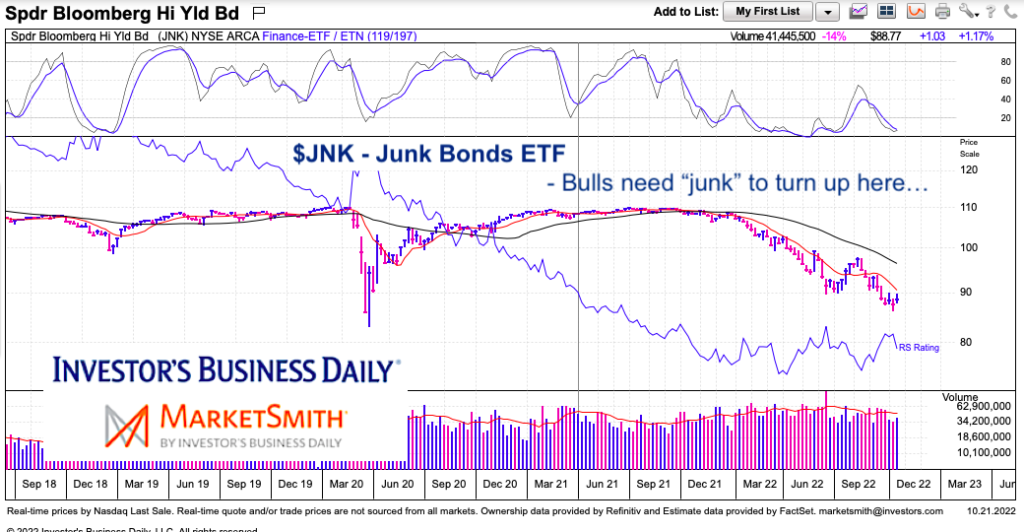
Today we look at junk bonds and why the junk bonds etf $JNK is at a critical parallel juncture with the broader stock market.
Note that the following MarketSmith charts are built with Investors Business Daily’s product suite.
I am an Investors Business Daily (IBD) partner and promote the use of their products. The entire platform offers a good mix of analysts, education, and technical and fundamental data.
$JNK Junk Bonds ETF “weekly” Chart
This is just one indicator to watch, but considering that the Dow Jones Industrials are turning higher and other key indices are “trying”, it’s important that junk bonds also turn higher.
As you can see, $JNK has traded sideways for 5 weeks and IF it turns higher (big IF), it may indicate a period of “risk on”, even if just a relief rally. Worth keeping an eye on.

Twitter: @andrewnyquist
The author may have a position in mentioned securities at the time of publication. Any opinions expressed herein are solely those of the author, and do not in any way represent the views or opinions of any other person or entity.


