Many astute bond investors are baffled by rising bond yields. Economic activity is slowing, inflation expectations are falling, the Fed is aggressively fighting inflation, and QT has begun. In the past, those factors were a surefire recipe for a rip-roaring bond rally. Today bond yields defy yesterday’s logic.
Clearly, something else is at play, and we think we know what it is.
Before we share our theory on why bond yields are rising, let’s review how very dependable yield relationships have been turned on their head this year.
Economic Activity and Bond Yields
Bond yields are predominately a function of economic activity, expected inflation rates, and the balance between the supply and demand for bonds.
Economic activity correlates well with bond yields for a couple of reasons. When the economy slows, inflation tends to weaken, thus making bond yields more attractive. Second, in times of economic weakness and uncertainty, investors often reduce exposure to risky assets in favor of more conservative ones, such as Treasury bonds.
The graph below shows the relationship between the ISM Manufacturing Index, a strong proxy for economic activity, and ten-year UST yields. Before 2022 the positive correlation was relatively strong. As we circle, the relationship has reversed this year. Yields are rising despite weaker ISM readings.
The second graph uses the same data but displays it in a scatter plot. The divergence between the relationship in 2022 versus the prior seven years is stunning.
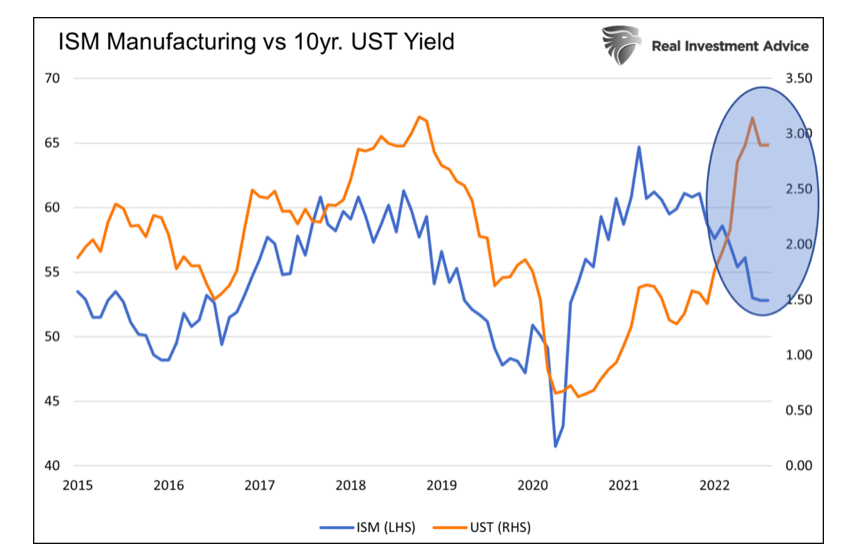
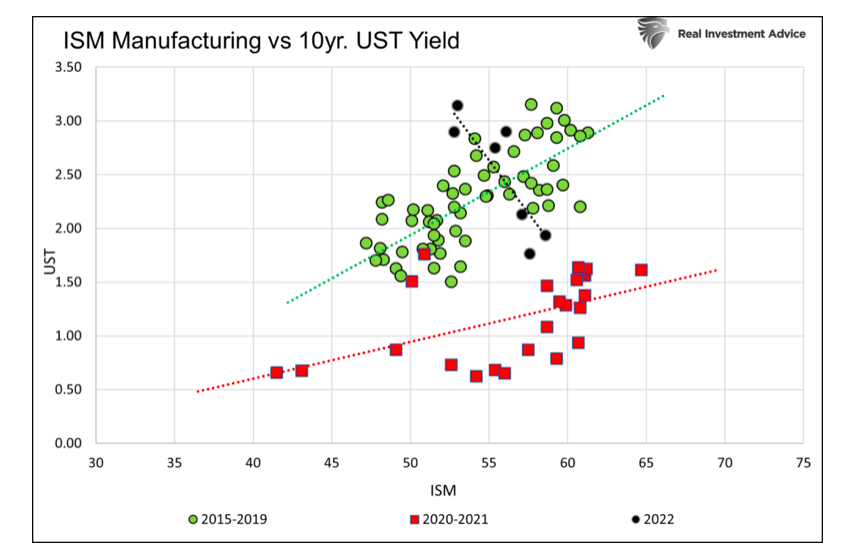
Before 2022, an increase in economic activity, therefore higher ISM readings, generally resulted in higher yields. In 2022, weaker ISM data is accompanying higher bond yields.
Inflation Expectations and Bond Yields
Most bond investors seek a yield above the expected inflation rate. If not, they are effectively losing purchasing power. Given this reasoning, higher inflation expectations should cause investors to demand higher yields and vice versa.
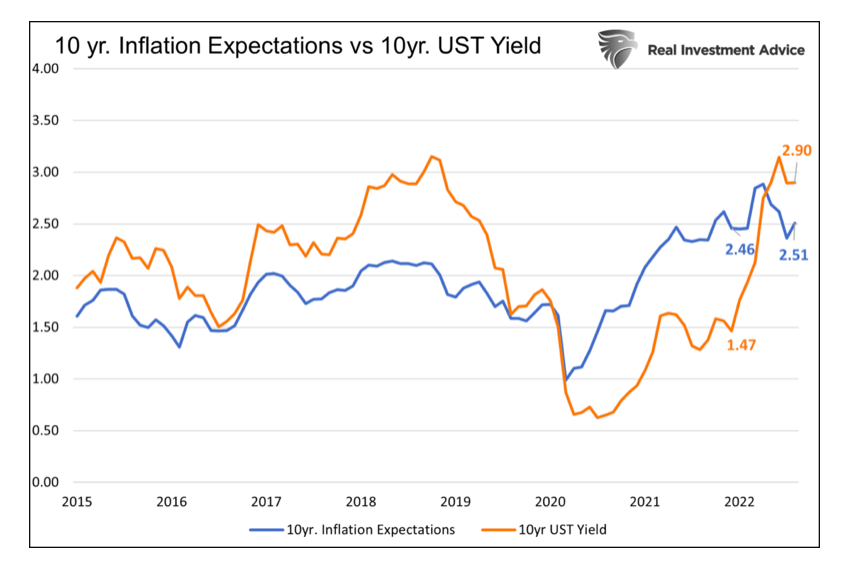
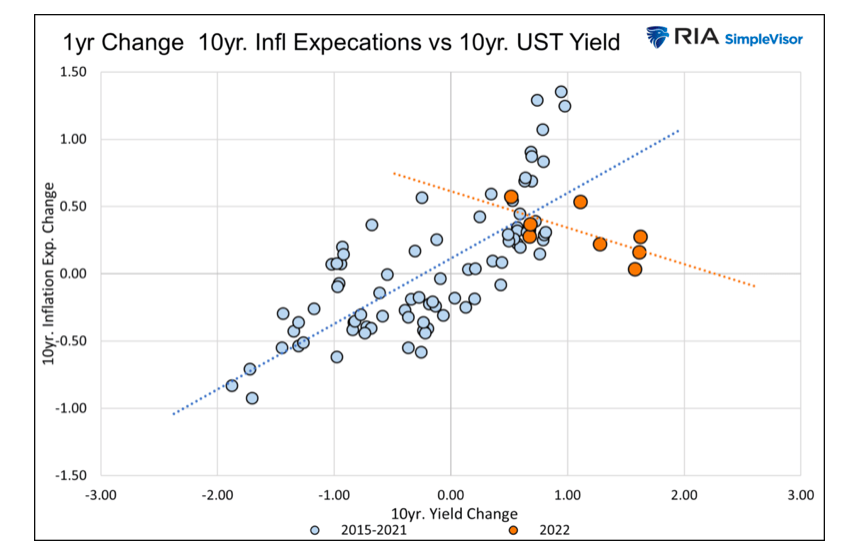
Like the relationship between ISM and yields, the connection between yields and inflation expectations was positively correlated before 2022, as we share below. This year, however, something is amiss.
Ten-year inflation expectations started this year at 2.46%. They are currently at 2.51%. Yet, ten-year yields have doubled over the same period from 1.47% to 2.90%. As a result, real yields have surged by almost 1.50%.
The data in scatter plot form in the second graph shows the relationship this year is counter to what has been the norm.
Supply and Demand
Some investors believe that heavy Treasury issuance is oversupplying the bond market and leading to higher yields. The reality is that Treasury issuance net of Federal Reserve purchases or sales is growing at a slightly sub-average rate. The one-year change in net issuance this year has averaged almost +4%. That compares favorably to over +6% from 2004 to 2021.
Historically, more debt issuance often accompanies lower bond yields. While counterintuitive, the Treasury tends to increase its debt load when the economy ails. This is often the result of more stimulus spending and reduced tax revenue. As previously noted, weak economic growth and lower inflation often result in lower bond yields.
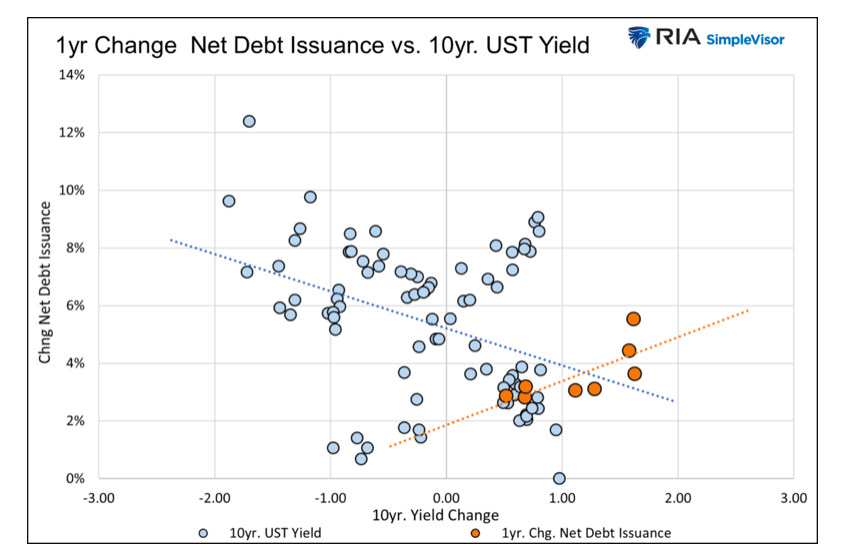
Contrary to history, net debt issuance is relatively low this year, but the correlation between net supply and yields is the opposite of what investors have grown accustomed to.
It Must be QT
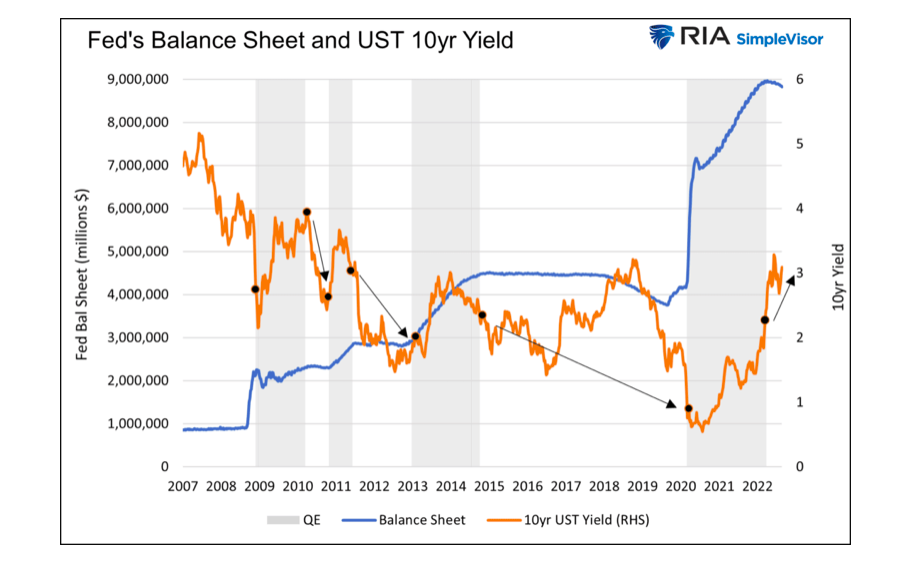
You are probably wondering about the elephant in the room, Quantitative Tightening (QT). Like debt issuance and bond yields, the relationship between Fed bond transactions and bond yields is counterintuitive. Bond yields tend to rise when the Fed buys bonds (QE) and fall when it is inactive or reduces its holdings (QT).
There is a sound rationale behind this seemingly irrational relationship. When the Fed buys bonds, they provide liquidity to markets. As such, the equity markets tend to rise and, in doing so, attract bond investors. The term “risk on” and QE are synonymous with each other.
When the Fed sells bonds (QT), they remove liquidity. Over time this leads to equity volatility and pushes investors to the safety of low volatility assets like bonds. This environment is called “risk off.”
The graph below shows bond yields often rise during QE and fall during QT or when the Fed is inactive. Unlike the prior episode of QT or the periods where the Fed was doing nothing, bond yields are rising.
Who is Selling and Why
As we highlight with numerous examples, the once dependable relationships of bond yields to economic and supply/demand factors are not holding up this year.
There is a new factor pushing yields higher. To shed light on whom or what it might be, we share a portion of a SimpleVisor update explaining a trade we did on September 7, 2022.
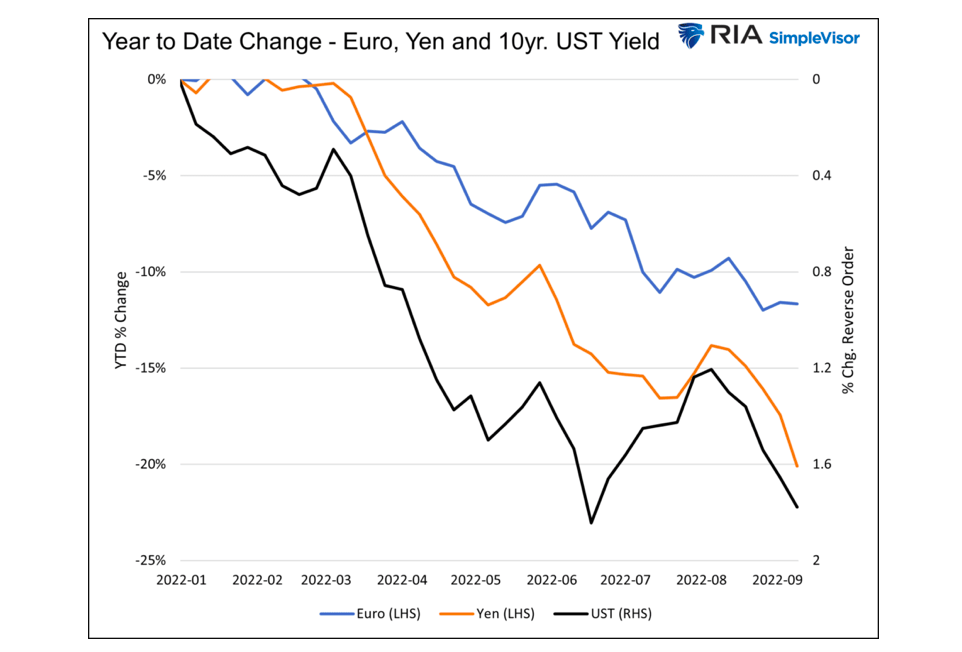
The euro has lost 12% to the U.S. dollar this year, while the Japanese yen has ceded nearly 20%. Those losses may not seem out of the ordinary compared to stocks or even bonds, but they are. Foreign exchange markets tend to be much less volatile.
A weak currency versus the dollar is often good for a country as it makes its exports more price competitive. However, a weaker currency makes imports more expensive. Given soaring inflation rates, especially energy prices, this instance of a stronger dollar is wreaking havoc on Europe and Japan.
Making matters worse, many foreign borrowers borrow in dollars. If they don’t hedge the currency risk, as many do not, a strong dollar results in higher interest and principal payments. Simply, they must acquire more expensive dollars to pay interest and principal. As such, a strong dollar is a de facto tightening of global monetary policy.
Europe is doing everything possible to solve its energy crisis, but its options are limited as it is primarily a supply problem. While alleviating supply challenges is difficult, they can reduce the cost with a stronger currency.
We suspect that the ECB and BOJ have been selling dollar assets, predominately Treasury bonds, to prop up their currencies.
The graph below shows the strong negative correlation between ten-year UST yields and the Euro and Yen.
Fed and Currency Swaps to the Rescue
Further in the commentary, we write:
In the past, the U.S. Treasury helped foreign countries manage their currencies via currency swap lines. Swap lines are off-market currency trades that allow countries to better manage their currency instead of selling dollar assets or printing their currency.
Given the sharp dollar appreciation and acute energy and inflation problems, we think the Treasury will reopen swap lines. Once open, the nations will not need to sell Treasury bonds. Further persuading the Treasury to curb dollar appreciation, they have significant funding needs, and the Fed is reducing its holdings of Treasury debt. The growing supply of bonds from the Fed and the Treasury creates a powerful desire to cap yields.
Essentially swap lines kill two birds with one stone.
Such action should cap U.S. yields and help limit inflationary pressures in Europe and Japan. Equally important, it helps defuse what is slowly becoming a financial crisis in those countries.
Summary
Tried and trustworthy relationships are failing bond investors. While powerful and concerning, we think the abnormal relationships are temporary. When the supply and demand for bonds normalize, bond investors will likely realize that economic, inflation and other factors warrant much lower yields.
Twitter: @michaellebowitz
The author or his firm may have positions in mentioned securities at the time of publication. Any opinions expressed herein are solely those of the author, and do not in any way represent the views or opinions of any other person or entity.

