The red-hot run higher in commodities sent inflation soaring higher. And this lead to the Federal Reserve raising interest rates at a fast clip.
BUT it appears that the commodities rally may be slowing down (or over). As this data gets prices in, could it lead to lower grocery bills (and easing inflation)?
Well, let’s turn to Joe Friday for “The facts, Ma’am. Just the facts.”
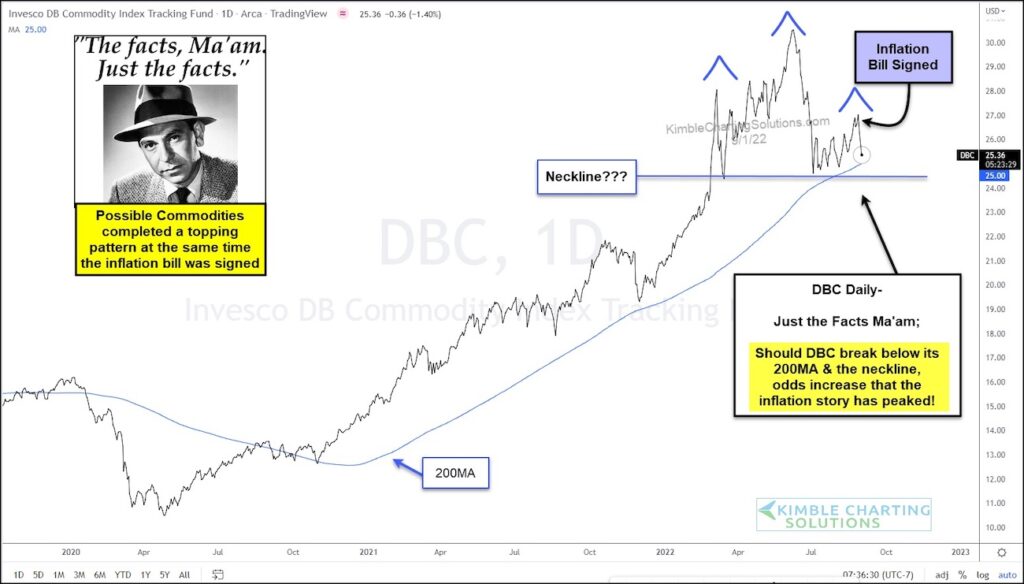
Today’s chart is pretty straight forward. It is a “daily” chart of the Commodities ETF $DBC and highlights a head and shoulders topping pattern that could lead to lower commodity prices. Active investors need to watch the neckline in the days/weeks ahead.
Is the inflation story about to change? Perhaps if support breaks. Stay tuned!!
$DBC Commodities Sector ETF Chart

Note that KimbleCharting is offering a 2 week Free trial to See It Market readers. Just send me an email to services@kimblechartingsolutions.com for details to get set up.
Twitter: @KimbleCharting
Any opinions expressed herein are solely those of the author, and do not in any way represent the views or opinions of any other person or entity.


