The bull market surge in 2020 and 2021, followed by the bear market swoon, are great reminders that liquidity and valuations are critical to managing wealth effectively. Unfortunately, most investors pay too much attention to one or the other, but not both.
Those assessing liquidity conditions and tracking valuations were prepared for the bullish stampede of 2021 and understood the risks that ensued when easy monetary and fiscal policy tides ebbed. Most others were left in the bull’s dust or are being ravaged by the bear.
We share our views on portfolio management to better appreciate the value of both liquidity and valuations. Further, we highlight our recent portfolio management activity to show how we navigated through the changing liquidity situation this year.
Our Perspectives on Valuations and Liquidity
Valuations help investors gauge the potential downside risk and upside potential in a stock or market. At the same time, assessing liquidity conditions, including technical analysis, and defining short-term trends help with investment timing and asset selection.
Today’s Environment – Liquidity
Current liquidity conditions dictate conservatism. The Fed is aggressively raising interest rates and reducing its balance sheet. Further, fiscal spending is falling well short of that in the prior two years. As a result, liquidity is exiting the financial markets, which augurs a bearish trend. As we wrote in the Don’t Fight The Fed:
“For example, nine months ago, the upward trend started to flatten. At the time, inflation was rising rapidly, and the Fed began talking about interest rate hikes. Since the initial expectations were for small rate hikes and no QT, the trend flattening and ultimate shift toward a downward direction was gradual. Since then, the downward trend has steepened as Fed rhetoric has grown increasingly hawkish.”
Until investors believe the Fed will reverse from its hawkish policy or at least be less hawkish, the trend for equity markets is likely lower. Given the hostile political environment and coming elections, it’s highly unlikely new fiscal stimulus will override that opinion.
Today’s Environment – Valuations
Having established that a downward trend is likely due to liquidity conditions, let’s now consider how far down the market can decline.
To help assess current valuations and create a range of potential outcomes, we use the S&P 500 CAPE P/E valuations. Similar analysis with other valuation methods provides a broader range of possible results.
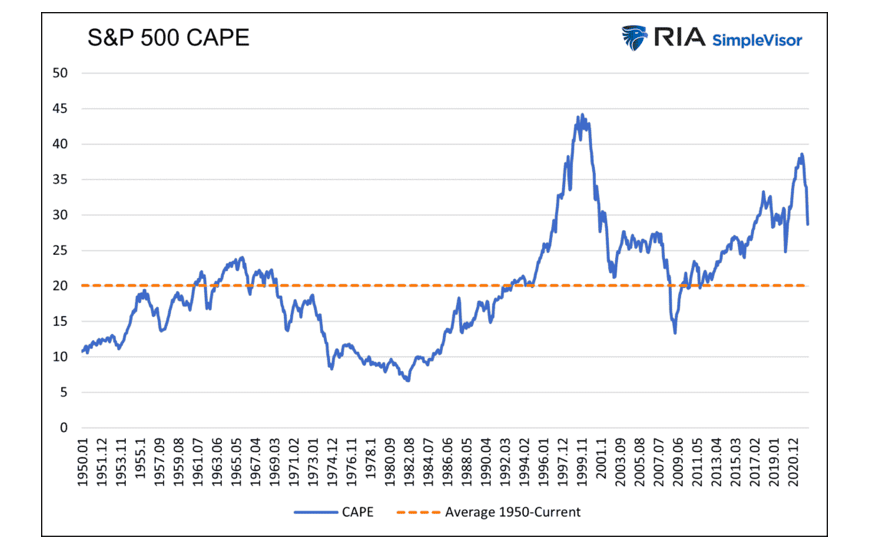
In late 2021, most valuation measures were at or near record levels. For instance, CAPE on the S&P 500 was nearly 40, over twice its historical average. In the last 140 years, CAPE was only higher for a brief period before the 2000 tech crash.
By late 2021, many valuation techniques required price declines of 30% to 60% to reach longer-term average valuations. In some cases, 80% declines were needed to get to the lower end of historical valuations.
We are not fearmongering, but consider that CAPE fell to seven in the bear market and recession of 1981-1982. That was the last time with comparable inflation as today. Assuming no change in earnings, the S&P 500 would have to drop to 925 to reach a CAPE of 7!
This year’s 20% price drawdown is mainly responsible for the CAPE falling from nearly 40 in late 2021 to 28, as shown below.
Valuation Risk Reward Ranges
To establish a reasonable risk-reward range, we use daily S&P 500 price data back to 1950. Further, we exclude data outside of one standard deviation of the average. This exercise incorporates about two-thirds of the data.
The CAPE on the S&P 500 can return to prior highs or reach single-digit lows. As such, we understand this increases the odds that our risk/reward range in this article is not wide enough.
To create our “risk range,” we calculate the current S&P 500 price that would bring the CAPE to its average, minimum, and maximum. As shown below, the S&P 500 would fall to 2647 (-32%) to reach its long-term average CAPE. More concerning, despite the recent drawdown, it sits above the upper band. A 5% decline gets it back within its historical band. The most significant risk is the S&P 500 falls to reach its lower band at 1584.
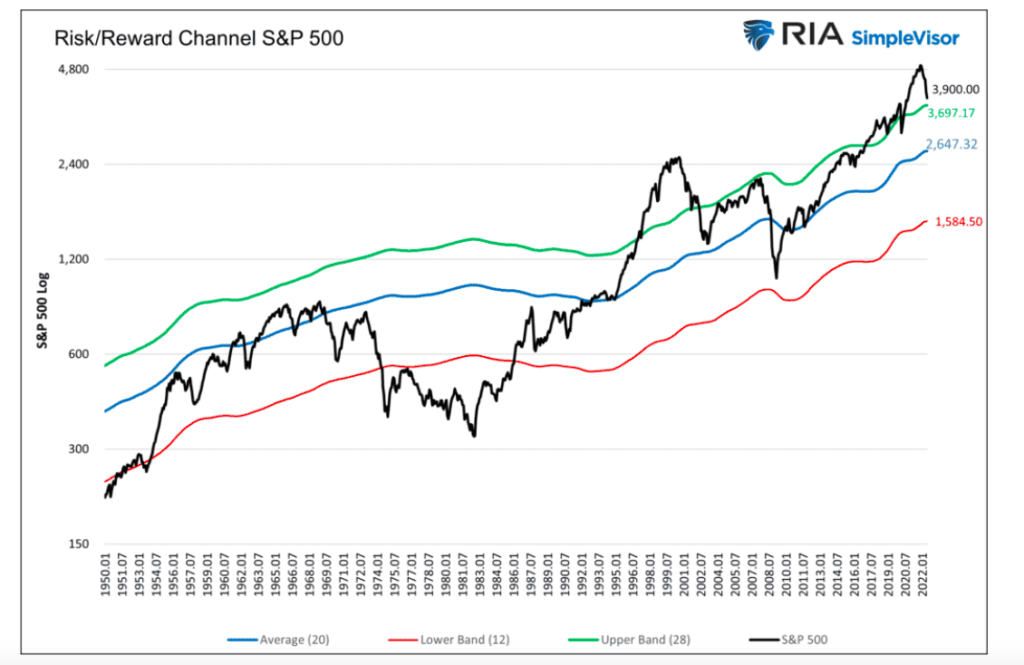
As mentioned above, the analysis is conservative as we only use a CAPE range of 12-28 to calculate the range. The second flaw is that we do not account for changing earnings.
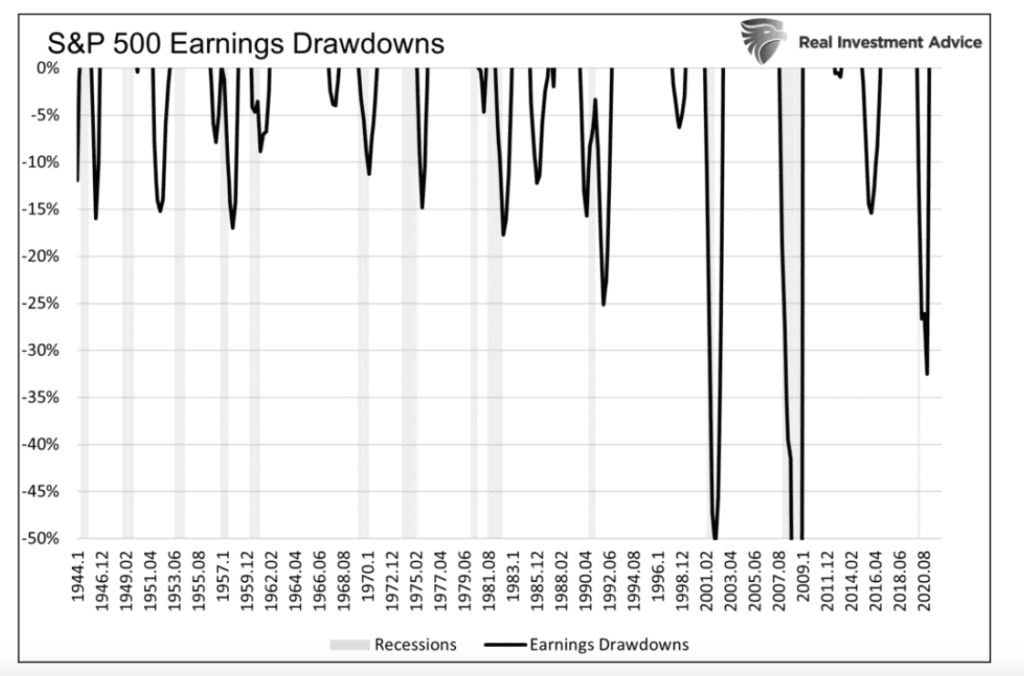
Below we show that earnings typically fall 10% to 25% during recessions. The last three recessions saw greater than average declines. Lower earnings, all else equal, increase CAPE valuations. However, CAPE uses an average of the previous ten years of earnings. As such, the effect of a few bad quarters or even a year or two does not significantly change the risk range.
Our Recent Experience
Through 2021, valuations rose well above norms, and the S&P 500 was moderately above the upper band. While such an environment was concerning, we knew that fiscal and monetary liquidity were flowing at unprecedented levels. Despite robust economic growth and increasing inflation, Jerome Powell was “not even thinking about thinking about raising rates.” The liquidity spigots were flowing full blast, and liquidity conditions drove asset prices much higher, valuations be damned.
As the year ended and 2022 began, the Fed was starting to worry inflation was not as transitory as initially thought. Massive doses of Fed liquidity were coming into question. Further, political dissension put a cap on further pandemic/economic fiscal spending. Plentiful fiscal and monetary liquidity conditions were about to make an abrupt U-turn.
RIA Advisors Portfolio Management 2021 and 2022
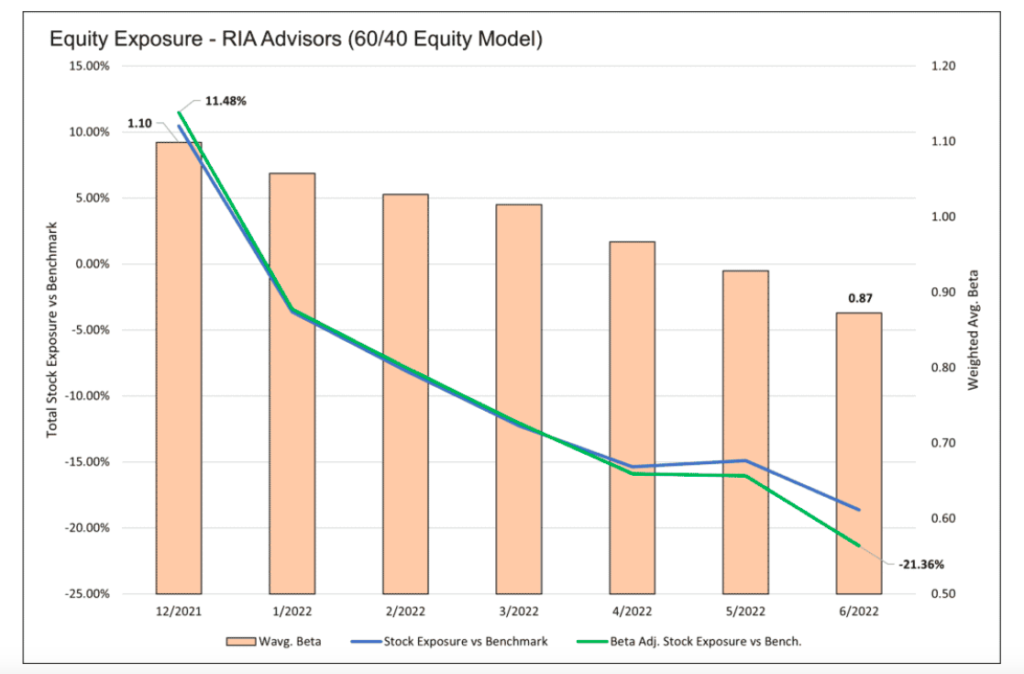
Our equity exposure in late 2021 reflected the bullish technical condition, positive liquidity assessment, and strong investor sentiment. Many times in the fourth quarter, we were overweight stock exposure versus our benchmark. Further, many of our stocks had betas greater than the market.
Sensing the Fed was about to pull the liquidity rug from the markets, we started reducing our risk starting on the first trading day of 2022. Not only did we sell shares to reduce our gross equity exposure, but we rotated from higher beta growth stocks to lower beta value stocks.
The graph below shows our beta-adjusted exposure went from 11.48% above our benchmark on December 31, 2021, to 21.36% below at the end of June. The change was a function of selling assets and reducing our weighted average beta from an above-market 1.10 to below-market .87.
Summary
No one has a crystal ball, but the tools to better recognize price trends and form risk/reward expectations exist and are easy to follow.
As long as the Fed focuses heavily on taming inflation with aggressive monetary policy, we should expect a bearish trend. We monitor inflation closely to evaluate how the Fed may adjust monetary policy for changes in inflation. We will reconsider our position when the Fed starts to ease off its hawkish rhetoric.
Twitter: @michaellebowitz
The author or his firm may have positions in mentioned securities at the time of publication. Any opinions expressed herein are solely those of the author, and do not in any way represent the views or opinions of any other person or entity.

