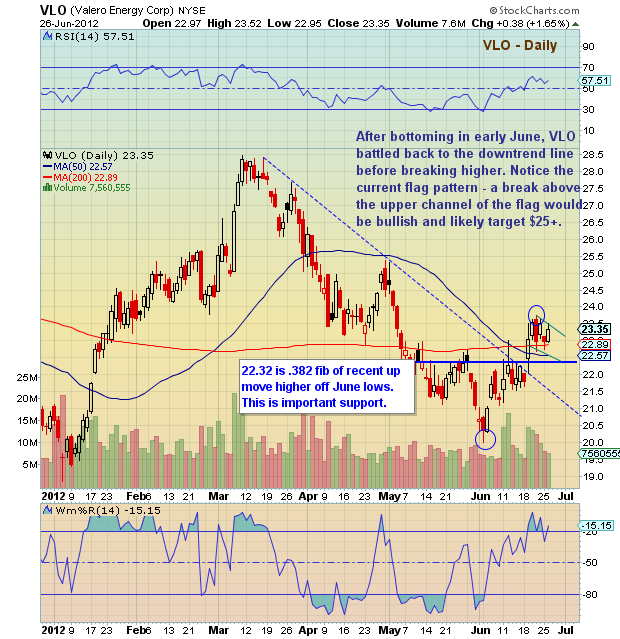
 After bottoming in early June, Valero Energy (VLO) battled back to the downtrend line before breaking higher. Notice the current flag pattern – a break above the upper channel of the flag would be bullish and likely target $25.
Note that $22.32 is the .382 fibonacci retrace of the recent move higher and important support.
Valero Energy (VLO) annotated daily chart with technical analysis overlay as of June 26, 2012. Price support and resistance levels with Fibonacci retrace levels. Oil and gas refining. Energy Sector. Valero Energy stock ticker VLO.
———————————————————
Twitter: @andrewnyquist and @seeitmarket Facebook: See It Market
No position in any of the securities mentioned at the time of publication.
Any opinions expressed herein are solely those of the author, and do not in any way represent the views or opinions of his employer or any other person or entity.


