The Federal Reserve and federal government have showered massive liquidity on the economy and markets to combat the pandemic. Their medicine worked. Economic activity rebounded quickly. Stocks and other assets soared in price, and in many cases, valuations now mirror those from 1999 and 1929. Fiscal spending is normalizing quickly, and the Fed is warning investors they are ready to remove stimulus. Such a reversal of monetary and fiscal liquidity does not guarantee a reversal of asset prices, but it means the odds of a bear market increase. As such, it’s time to start thinking about bear market strategies.
Bear vs. Bull Market Strategies
Investors spend most of their time playing offense in bull markets. In other words, they select the best asset classes, assets, sectors, and securities they think will outperform the broader markets. In a bullish trend, the punishment for being wrong is often positive returns, albeit not as good as the market.
Bearish markets are infrequent but devastating to your wealth unless defensive strategies are employed. Some investors fail to react to bear markets, and it can take years to recoup losses. Others panic when markets have already given up substantial gains and lock in losses.
We prefer to play defense when markets are in bear markets and protect our wealth. Not only does such an approach limit losses, but it leaves us with cash when stock valuations are more reasonable.
Given the coming change in the monetary regime and extreme valuations, it is best to remind ourselves of bear market trading patterns and consider strategies to help retain our wealth in case the bear wakes from hibernation.
Benefits of Sidestepping Bear Markets
The graph below tracks the S&P 500 over the last 30 years. The red sections represent one-year periods where the S&P had a negative price return. As the graph shows, there have only been two prolonged bear markets in the last 30 years.
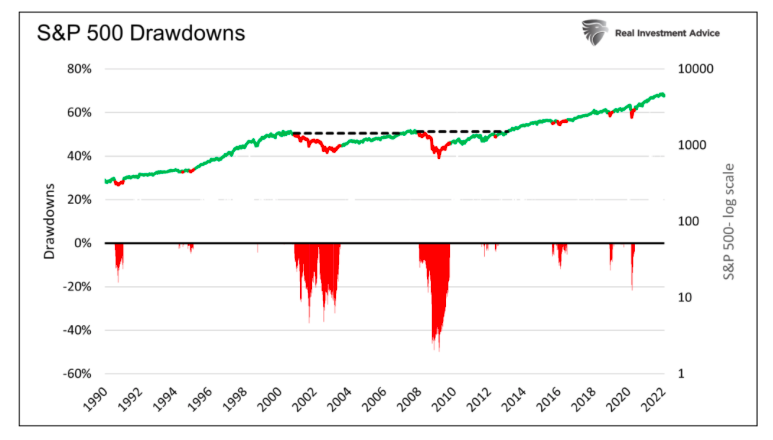
Of the last 30 years, only about 4.5 years were spent in the two aforementioned bear market declines. Yet, investors spent over a third of the period recovering from those losses. The dotted lines show it took six years after the tech crash and five years after the financial crisis to regain prior highs.
Bear vs. Bull Markets
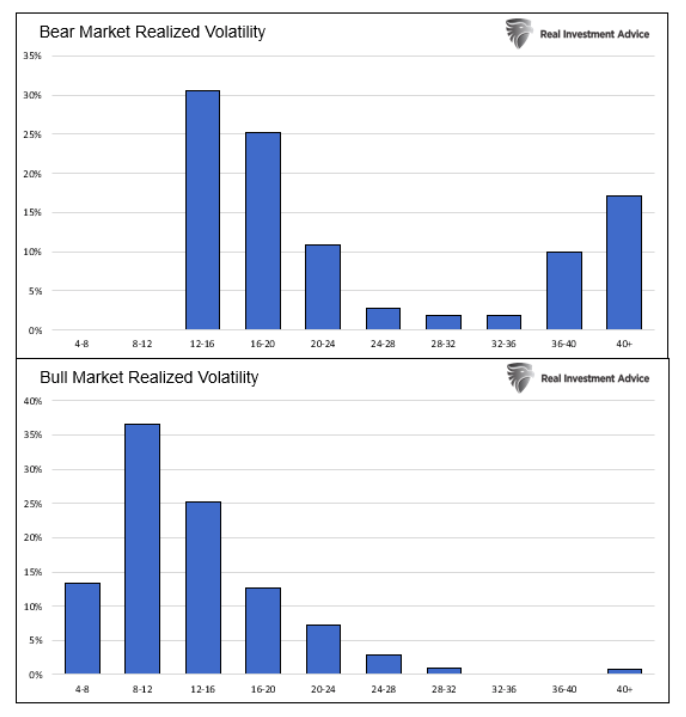
Bear markets tend to be short-lived but are laden with significant up and down price movements. Bull markets last much longer and offer lower levels of volatility. Since 1990, the average annualized realized volatility for the S&P 500 was 14.7%. During the two bear markets of 2000 and 2008, it averaged 23.9%. Through the remaining periods, it averaged 13.2%.
The histograms below show the realized volatility profiles of bull and bear markets since 1990. 75% of the daily realized volatility readings in a bull market are 16% or less. 70% of realized volatility readings in a bear market are 16% or higher. Almost a third of the bear market’s readings are above 28%.
It is worth examining price movements during the two bear markets to understand their distinctive patterns better so we can develop potential strategies.
2000
The graph below shows the bear market of 2000 to 2003. As highlighted in red, the bulk of the move lower occurred in three large chunks. The first decline saw the market lose 26% over eight months. The second sell-off had a similar loss but in half the time. The third and final decline was also similar in percentage terms but occurred again in half the time of the second one.
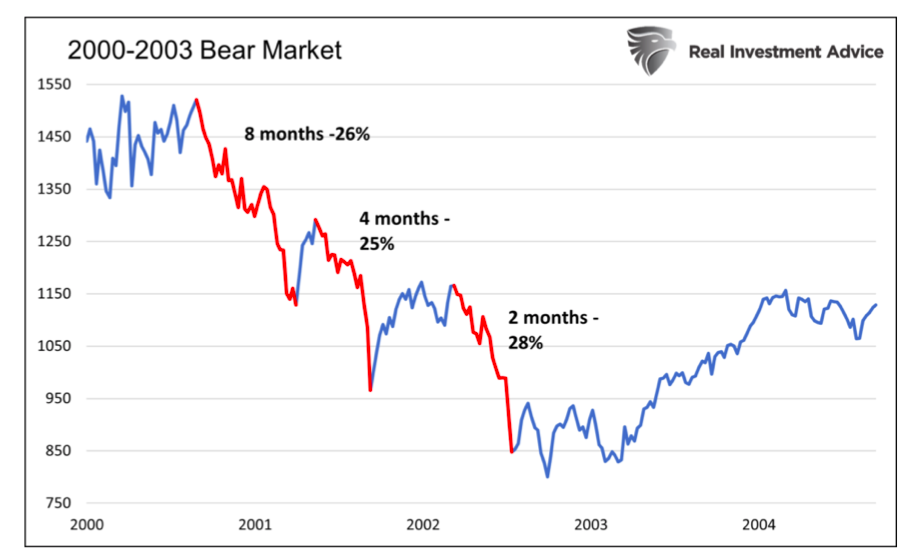
Equally important, there were significant rallies during the three-year period. After the first significant decline, the S&P 500 rallied 14% in a little more than a month. The second decline was followed by a 26% rally over two and half months. These bear market rallies offered a sense of relief to investors and hope the downslide was over. They both proved fatal to investors that bought the dip.
The graph below shows that the NASDAQ gave up 83% from top to bottom, but within the decline were two rallies of over 50% and three other significant rallies.
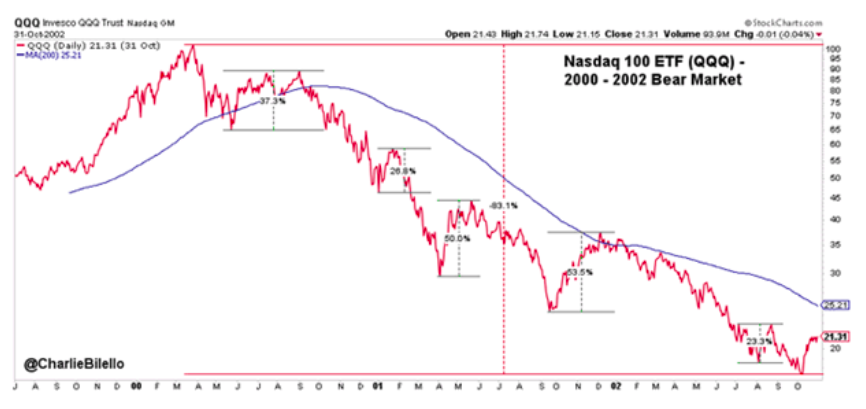
In bull markets, investors tend to buy the dips (BTD). In bear markets, we advise selling the rips (STR)
2008
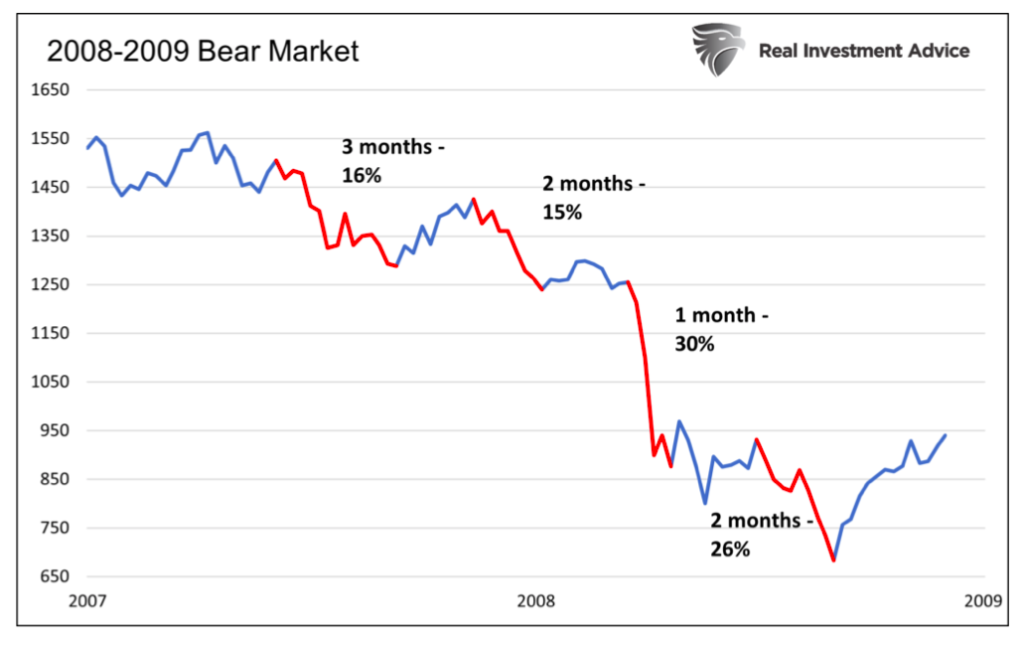
The bear market of 2008-2009 was different than 2000-2003, but it offers similar lessons. As shown below, the decline happened in four significant but quick moves. As in 2000-2003, each move lower happened in successively briefer periods; however, the final leg lower was slightly extended versus the prior one. Unlike 2000-03, the rallies between sell-offs were not impressive.
The Math of Gains and Losses
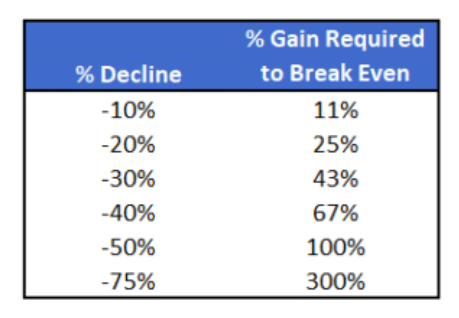
As you think about bear market rallies and the graphs above, it’s worth a quick reminder that percentage gains and losses are not comparable. The table below shows the percentage gain required to offset a loss. It serves as a reminder that bear market rallies can post large gains, but they pale compared to lesser percentage losses.
Trading a Bear Market
Volatility and emotions make bear market trading frustrating and complicated. As we show, bear market declines happen in short and volatile periods. Further, those periods tend to shrink in duration as the bear market continues. Such activity is logical, as the initial transition from a bull to a bear market often occurs when investors are bullish with little fear. Those unsuspecting of what is coming, provide a steady bid in such a circumstance. They think they are buying stocks at a discount.
Once a bear market establishes itself, bullish investors tend to become less zealous. They lick their wounds, become more fearful, and are not as quick to buy dips. Therefore, subsequent downdrafts happen in shorter time frames.
Bear market rallies can be intense. Such high volatility makes it difficult to manage our emotions. Should we be greedy or fearful? For more on understanding and tempering our trading biases, please read our article Fear and Greed: An Investors Two Worst Enemies.
In a bear market, technical analysis becomes a vital tool. However, oversold markets can stay oversold longer than is typical in bull markets. They can also reach more extreme oversold levels than we are accustomed to. Lastly, oversold conditions may not imply a strong rally but merely a consolidation before another step lower.
Summary
“It’s always very difficult in a bear market, stocks don’t trade with rhythm you get these vicious rallies, you get squeezed out of shorts, people play all sorts of games” -Stanley Druckenmiller
Markets spend a large majority of their time in bullish trends. As such, investors spend most of their time playing offense and choosing assets and sectors that will outperform the market. Long bull markets can make us complacent and forgetting of how to play defense.
Defense is complex, as it bucks our predisposition to be fully invested. Volatile markets also exaggerate our fear and greed emotions that drive irrational behavior.
In a bear market, we recommend relying on technical studies but understanding the fundamental backdrop. Successfully dodging a bear market with infrequently used strategies allows one to buy stocks at deep discounts when others are selling. It may not be comfortable fighting the fearful herd, but history has proven those rare periods are incredibly beneficial to your wealth.
As Warren Buffett once said- “be fearful when others are greedy and greedy when others are fearful.”
Twitter: @michaellebowitz
The author or his firm may have positions in mentioned securities at the time of publication. Any opinions expressed herein are solely those of the author, and do not in any way represent the views or opinions of any other person or entity.


